Who is Munawar Faruqui? Why was he arrested?

The case was initially heard by Madhya Pradesh High Court which declined him bail saying, “liberty of a person has to be balanced with his duties towards other citizens.”


Who is Munawar Faruqui? Why was he arrested?

The case was initially heard by Madhya Pradesh High Court which declined him bail saying, “liberty of a person has to be balanced with his duties towards other citizens.” He was accused of passing “indecent” remarks about Hindu deities during a show. Faruqui later moved a writ petition before the top court challenging Madhya Pradesh High Court’s order denying him bail.

“He was arrested for jokes he didn’t crack. A presumption of and anticipation of a so-called criminal act cannot be an offence. The police registered a case and arrested him without verifying the facts,” Anshumaan Shrivastava, the comic’s lawyer, told the BBC’s Soutik Biswas recently.


After fighting for basic necessities for 70 days, Munawar Faruqui has been announced as the winner of Lock Upp. The Kangana Ranaut show also had Payal Rohatgi, Anjali Arora, Azma Fallah and Shivam Sharma as finalists. Along with the trophy, Munawar also took home Rs. 20 lakh cash prize and a brand new car.

The complainant was Eklavya Gaud, the son of a politician from India’s governing Bhartiya Janata Party (BJP), which is also in power in Madhya Pradesh state, where the arrest happened.

Mr. Gaud, who leads a right-wing Hindu outfit, had interrupted the show on 1 January, complaining that Mr. Farooqui’s sets were offensive to Hindus.

A mobile phone video recorded by an audience member shows Mr. Farooqui pleading with Mr. Gaud, saying that he also jokes about Muslims in his shows and that he should be allowed to continue.

“I just want to make people laugh. If anyone feels offended I will never do it again,” he tells Mr. Gaud. Audience members can be heard yelling, “Let the show begin.”

A lawyer had filed a case against the comic last year in Uttar Pradesh state for allegedly making derogatory remarks against India’s Home Minister Amit Shah and hurting Hindu religious sentiments in different videos.

[contact-form][contact-field label=”Name” type=”name” required=”true” /][contact-field label=”Email” type=”email” required=”true” /][contact-field label=”Website” type=”url” /][contact-field label=”Message” type=”textarea” /][/contact-form]

A Turbulent Journey: Why Indian Aviation Sector is Struggling To Stay Afloat [Go First]


The Indian aviation sector has been facing turbulent times in recent years. On 02-May-2023, Go First Airlines (Founded as GoAir) voluntarily filed for Bankruptcy. On the date of writing this article. the airline company has canceled all flights till 12-May-2023. I’ll try to explain why in a buoyant and growing economy like India, Indian Airline companies are not able to survive.

With the rise of an emerging Indian middle class wanting to travel, many airlines have ordered billions of dollars worth of planes. Following is the likely composition of new planes ordered by Air India to Boeing and Airbus in February 2023.

Description Unit QTY Remark
Airbus A350s Nos. 40 Widebody
Airbus A320/321 Neos Nos. 210 Single Aisle
Boeing 787 Nos. 20 Widebody
Boeing 777-9S Nos. 10 Widebody
Boeing 737 MAX Nos. 190 Single Aisle
Total Nos. 470

India’s biggest Airline company Indigo Airlies is also planning to order a few widebody airplanes for its international routes.

The recent ordering has created a cauldron of competition in what is now the world’s most populous nation.

However, this has not translated into profits, and the pandemic has only worsened the situation.

Let’s try to understand why Indian Airlines are struggling to stay afloat.

The Indian aviation sector has faced various challenges that have made it difficult for many airlines to stay financially stable and profitable. Some of the key factors contributing to the struggles of the Indian aviation sector include:

  1. Intense Competition: The Indian aviation market is highly competitive with several airlines vying for market share. This competition often leads to price wars, making it challenging for airlines to maintain profitable pricing strategies.
  2. Price Sensitivity: Indian consumers are known for their price sensitivity. They are often looking for the lowest fares, which puts pressure on airlines to reduce prices to remain competitive. This can result in thin profit margins.
  3. High Operating Costs: Operating costs for airlines in India, including fuel, airport charges, and maintenance, are relatively high. Fluctuations in fuel prices can significantly impact the bottom line of airlines.
  4. Taxation: Aviation fuel in India is subject to high taxes, making it more expensive for airlines. This affects their operational costs and profitability.
  5. Infrastructure Challenges: Many Indian airports face congestion and infrastructure limitations. This can lead to delays and operational inefficiencies, impacting the overall passenger experience.
  6. Regulatory Hurdles: The Indian aviation sector has faced regulatory challenges, including restrictions on international operations and complex rules regarding airline ownership and foreign investment.
  7. Economic Factors: Economic fluctuations and economic downturns can impact passenger demand for air travel. During economic downturns or crises, people tend to cut back on discretionary spending, including travel.
  8. Pandemic Impact: The COVID-19 pandemic had a severe impact on the aviation industry worldwide, including in India. Lockdowns, travel restrictions, and a significant drop in passenger demand led to revenue losses and operational challenges.
  9. Rising Debt: Many Indian airlines have struggled with high levels of debt, which can be a significant financial burden. Servicing this debt can limit the financial flexibility of airlines.
  10. Lack of Infrastructure Investment: While there have been some improvements, India’s aviation infrastructure still faces challenges. Modernizing and expanding airports, air traffic control systems, and other facilities is crucial for the sector’s growth.
  11. Fierce Airline Failures: Over the years, several Indian airlines have faced financial difficulties and even ceased operations. This has created uncertainty in the industry and impacted passenger trust.
  12. Cyclicality: The aviation industry is cyclical, with periods of growth followed by downturns. Airlines need to be prepared for these cycles and have robust strategies in place to weather economic downturns.

Despite these challenges, the Indian aviation sector has shown resilience and potential for growth. Some airlines have adapted by diversifying their offerings, improving operational efficiency, and exploring new routes and markets. Government initiatives to promote regional connectivity and tourism can also play a role in reviving the sector. However, addressing the underlying challenges will be essential for the long-term sustainability and growth of the Indian aviation industry.


Recent History of a Few Airline Companies Going Belly Up

The history of airline companies in India is not so motivating:

Go First Airlines Story 

The reasons for airline failures in India vary, but it mostly boils down to a mix of low-cost fares, high taxes on fuel, and cut-throat competition. Needless to say that the majority of Indian domestic flyers are hypersensitive to changing prices especially when it comes to Airtravels.

Pratt & Whitney (P&W) effect

Go Airlines India Ltd. sought insolvency protection, blaming the American aircraft engine manufacturer Pratt & Whitney (P&W) for the mess.

The airline has said that the manufacturer has failed to supply parts and replacement engines needed for the Airbus A320neo jets. As this aircraft is the backbone of the GoAir’s fleet, the airline said, non-supply forced it to ground about half its planes. Even the arbitration court mandated Pratt & Whitney to supply the parts and the engines. The engine maker, a unit of Raytheon Technologies Corp., has disputed the claim.

GoAir has struggled in the past as well. It grew more slowly than rival IndiGo. Over the years, Indigo Airlines now controls over half the domestic market.

GoAir now has to borrow heavily to pay lease rentals, airport dues, and salaries during the pandemic when its jets were grounded.

Industry experts say that not all of Go First Airlines’ woes could be attributed to P&W alone. There are other issues attributed to the collapse of the airline. Suggested ReadingWhy do Airline companies operate at a loss in India [detailed report]?


Why Indian Aviation Sector is Struggling


The reasons for the Indian aviation sector’s struggle vary. But it mostly boils down to a mix of dirt-cheap fares, high taxes on fuel, and cut-throat competition. All these reasons are compounded by the disruption from Covid.

Government’s Role

The government has not been very helpful to struggling airlines as well. Successive and largely populist governments have shied away from offering direct support to struggling airlines.

Yet with BJP seeking a third term in elections next year, more airline failures could dent its reputation for championing the industry.

Indian Aviation Sector’s Potential

Why Indian Aviation Sector is Struggling - 9 Years Traffic Data


The Indian aviation market is an attractive one. Before Covid (2014 to 2020), the sector’s growth rate was about 10.6% per annum. The growth calculation is based on the number of travelers handled by Indian airports between the financial year (FY) 2014 and 2022. If we’ll consider only domestic travelers, the growth rate was even more impressive at 12.2% per annum (between 2014 to 2020)

We have seen two sides to the Indian aviation sector. On one side we have an example of Go First closing down its operations. On the other side, we are seeing new airlines entering the sector. Only last year, India approved the launch of a new airline called Akasa Air. Akasa began flying on 07-Aug-2022 last year.

The growth prospects are attracting companies to enter the aviation sector. But the high cost and cut-throat competition and extremely price-sensitive market are pushing weak companies toward collapse.

Conclusion

In a country where air travel has traditionally been limited to the rich, rising incomes and growing aspirations have opened up a new market of first-time fliers. These fliers are willing to trade the luxury of full-service carriers for the low-cost fares of budget airlines. This has led to a proliferation of airlines in India. But with the speed with which new players enter the industry, old players exit at the same speed.

Both established players and new entrants vying for a slice of the pie.

However, as the recent spate of airline failures has shown, the market is tough, and not everyone can make it. With cut-throat competition, high taxes on fuel, and low fares, airlines are finding it increasingly difficult to turn a profit. The pandemic has only made matters worse, with airlines facing a prolonged slump in demand and increased costs due to safety measures.

Despite the challenges, the allure of the Indian aviation market remains strong, and new players continue to enter the fray. Whether they will be able to survive the tough conditions and turn a profit remains to be seen.

[Note: How investors should look at these scenarios of the Indian Aviation sector? A sector/industry growing at 10-12% per annum in the long term a big thumbs up. But the high cost and weak pricing power are causing badly managed airline companies to bow out. But good airline companies, that will survive the test of time, can compound high returns in the long term (like 10-15 years). One such example is Interglobe Aviation (Indigo). In the last 1-year, its share price is up by 25%]

INTERGLOBE AVIATION Share price in last 1 year


        A Turbulent Journey: Why Indian Aviation Sector is Struggling To Stay Afloat [Go First]

[contact-form][contact-field label=”Name” type=”name” required=”true” /][contact-field label=”Email” type=”email” required=”true” /][contact-field label=”Website” type=”url” /][contact-field label=”Message” type=”textarea” /][/contact-form]

How To Invest Large Sums of Money For A Long-Term Horizon?


A majority of my blog readers have a long-term investment mindset. Hence, I often get this type of question that says, how to invest large sums of money for a long-term horizon? I’ll try to answer this query from my perspective. I’ll speak as if I’ve to walk the talk. I also realize that not all of my readers are as inclined to direct stock investing as me, so I’ll write with a wider perspective.

Investing large sums of money can be a daunting task, especially when the investment horizon is long-term, like 15 years or more. It requires a lot of research, an understanding of market trends, and patience.

However, investing wisely can help one achieve financial security and meet long-term financial goals.

In this quick guide, we will read how to invest large sums of money for a long-term horizon.

Risk Analysis and Management


Risk analysis is the process of identifying potential risks that may affect the investment portfolio. There are several types of risks, including market risk, inflation risk, credit risk, liquidity risk, and geopolitical risk. It is important to understand these risks and manage them effectively to minimize potential losses.

Knowing about all these risks can be intimidating for retail investors. Hence, the easiest way to manage the majority of these risks is through portfolio diversification. Diversification means spreading your investment across different asset classes, such as stocks, equity funds, debt funds, gold, cash, real estate, etc. Diversification helps to reduce the risk of loss, as different asset classes may perform differently under different market conditions.

Another way to manage risk is to allocate assets based on risk tolerance. Risk tolerance refers to the level of risk that an investor is willing to take. It is important to determine your risk tolerance before investing to avoid taking on too much risk or too little risk.

Determining Risk Tolerance

A retail investor should determine his/her risk tolerance before investing. Risk tolerance refers to one’s ability and willingness to take on risk in your investments. A person’s risk tolerance helps to determine the right mix of investments for the portfolio, and how much one should allocate to each asset class.

Here are some steps to determine the risk tolerance:

  • Assess the financial situation: Before investing, it’s essential to assess the financial situation of a person. It will include income, expenses, debts, and savings analysis. This will help to understand the financial goals and how much risk one can afford to take.
  • Evaluate the investment goals: Consider the investment goals, which include the time horizon, liquidity needs, and desired returns. The investment goals help to determine the right mix of assets for your portfolio.
  • Understand the risk tolerance: Your risk tolerance is determined by several factors, including your age, income, investment experience, and personal preferences. Some investors may be comfortable taking on more risk, while others may prefer a more conservative approach.
  • Take a risk tolerance questionnaire: One can also use questionnaires that can help to determine ones risk tolerance. These questionnaires ask a series of questions about your investment goals, financial situation, and risk preferences to provide a risk profile and suggested portfolio allocation. This is one of the more accurate free risk analyzers you can try.

Asset Allocation / Portfolio Composition

Once a person determines his/her risk tolerance, asset allocation can start based on the risk appetite.

Here are some general guidelines for asset allocation based on risk tolerance:

Conservative

Conservative - Chart

Investors with a low-risk tolerance may prefer a portfolio that is heavily weighted towards fixed-income investments, such as bank deposits, debt funds, bonds, etc. As a conservative investor, my prime focus will be on income generation and not on capital appreciation. My portfolio allocation would be about 50% in pure debt funds & FDs, 25% in hybrid funds, 10% in index funds, 10% in multi-cap mutual funds, and 5% in cash.

Based on this asset allocation, my estimate is that the average yield of this diversified portfolio will be about 10% per annum.

Conservative - Avg Return

Moderate

Moderate - Chart

Investors with a moderate risk tolerance may prefer a portfolio that is more balanced between fixed income and equities. As a moderate investor, my prime focus will be on capital appreciation but with return expectations not greater than average market returns. My portfolio allocation would be about 50% in index funds, 20% in multip cap funds, 10% in hybrid funds, 10% in debt funds & FDs, and 10% in cash.

Based on this asset allocation, my estimate is that the average yield of this diversified portfolio will be about 11.5% per annum.

Moderate - Avg Return

Aggressive

Investing large sums of money for long term - Aggressive - Asset Allocation - Chart

Investors with a high-risk tolerance may prefer a portfolio that is heavily weighted towards equities. As an aggressive investor, my prime focus will be on capital appreciation with market-beating return expectations. My portfolio allocation would be about 40% in stocks, 30% in multi-cap funds, 10% in index funds, 5% in hybrid funds, 10% in debt and bank deposits, and 5% in cash.

Based on this asset allocation, my estimate is that the average yield of this diversified portfolio will be about 15% per annum.

Aggressive - Avg Return

It is important to remember that asset allocation should be reviewed regularly and adjusted as needed to ensure that it aligns with your investment goals and risk tolerance. By understanding your risk tolerance and allocating your assets accordingly, you can build a well-diversified portfolio that is tailored to your specific needs and preferences.

Systematic Investing

A diversified portfolio allocation should be the target. It is important to invest large sums of money in a systematic manner to avoid the need to time the market. This will also ensure that one gets the best possible average price for the assets.

Here’s a suggested method for buying the assets in a phased manner (and not in one go).

The Method
  1. Determine The Investment Horizon: It is important to determine the investment horizon before investing. Since our time horizon is long-term, about 10-15 years, it is best to invest in a staggered manner over a period of time. It will reduce the impact of short-term market fluctuations.
  2. Create a Schedule: Once the investment horizon is determined, create a schedule to invest the money (assuming it to be in large sums like 10 lakhs) over the next 6-12 months. This will ensure that one is investing the money systematically and gradually, rather than investing all at once.
  3. Start with Smaller Allocation First: A conservative investor has a smaller allocation to equity and cash, so one must start from there. Similarly, an aggressive investor has a relatively small allocation to debt funds, and cash, so can start with these assets. Accumulating assets of smaller weights in the first 2-3 months should be a general strategy. But when it comes to equity allocation, make sure that the index is not currently at its peak.
  4. Gradually Add Other Assets: Once smaller allocations are done, one can start to add other assets to the portfolio. Spreading the investments in the remaining assets over the remaining months of the investment schedule should be the strategy.
  5. Monitor your portfolio: It is important to monitor the portfolio regularly to ensure that the asset allocation is in line with the investment goals and risk tolerance. Rebalancing the portfolio, from time to time, will be necessary to maintain your desired asset allocation. What is rebalancing? Reducing the overweighted assets, and putting the proceeds into underweighted assets.

By investing systematically over a period of time, one can avoid the risk of investing all money at once. This way one can benefit from the potential for long-term market growth.

Conclusion

Remember, investing requires patience and discipline, so it’s important to stick to your investment plan and avoid making impulsive decisions based on short-term market fluctuations.

Investing large sums of money for a long-term horizon requires careful analysis and planning. It is important to understand the risks involved and manage them effectively through diversification and asset allocation. A well-diversified portfolio with a focus on quality companies and bonds can provide a solid foundation for long-term growth.

Finally, systematic investing can help to build a disciplined investment strategy and reduce the impact of market volatility. By following these principles, investors can make informed decisions and achieve long-term financial goals.

How To Invest Large Sums of Money For A Long-Term Horizon?

[contact-form][contact-field label=”Name” type=”name” required=”true” /][contact-field label=”Email” type=”email” required=”true” /][contact-field label=”Website” type=”url” /][contact-field label=”Message” type=”textarea” /][/contact-form]

How many stock are there in the Stock Engine


 Our Stock Engine’s effectiveness does not come from its fancy reporting style. It comes from its underlying algorithm that makes the complicated stock analysis more interpretable for its users. Ultimately, the purpose of any stock tool is to highlight if a stock is worth investing or not. The latest update is focused completely on making our algorithm more interpretable.

The purpose of starting the Stock Engine app was to make stock interpretation easy for even a novice investor. When we first launched our web app in February 2022, It was one big feat. Today in May 2023, we have rolled out a major update. Between 2022 and 2023, we realized something very amazing. No matter how strong is the underlying algorithm, it will serve its purpose only if the users can interpret its analyzed results. Throwing only numbers and jargon at them is meaningless.

So, in this update, our focus was to make the Stock Engine an easy-to-comprehend stock tool. Though it gives no investment advice, we decided to develop this tool ‘up for it.’ With the same purpose, we launched our web app in 2022 (earlier it was in an Excel Avatar). In our latest update, we have made the critical stock parameters more comprehensible. How? This is what I’ll tell you in this article.

So let’s start with the basics of stock investing and then allow me to explain how this latest version of the Stock Engine answers those basic queries.


Introduction

Every time we think about stock investing, our purpose is to know if the stock is worth investing or not. Two things make a stock investible, the underlying fundamentals of its business and its price valuation.

The underlying fundamentals of a stock are decided by its growth, profitability, financial health, quality of management, and economic moat. The price valuation decision can be taken by comparing the stock’s fair price (intrinsic value) with its current price. The Stock Engine app tries to uncover all these critical parameters of a company (stock).

#1. Overall Impression – A Stock is Worth Investing Or Not

The Stock Engine - Overall Impression

The stock’s detail page will immediately deliver my first impression of the stock. In this example, it is concluded that if I’ve to invest in this stock, I’ll wait for a correction.

If one wants to know more about what is the basis of my impression of the company, scroll down to the “Overview” section of the app.

The Stock Engine - Overall Impression

There you will see that the overall score of the stock is 61.78% (Very Low). Generally, a stock whose overall score is 75% or higher will garner a preferable overall impression.

The low overall score rating of our example stocks is because of its price being “Very Overvalued” but its Fundamentals are “Very Strong“.

It means that the Overall Score of this stock is low mainly because of its expensive price valuation. Though the business is fundamentally very strong.

Had the price of this stock been lower, it would have become investible. This is why my comment about the stocks at the beginning of the page was, I’ll wait for corrections (will not invest in this company now).

Practical Tip

Suppose the Stock Engine thinks that the fundamentals of the company are very strong, but it will wait for the price correction to buy it as its price is very overvalued. In this case, I’ll suggest the users look at the second element of the Stock Engine app, the last 14-day, 30-day, and 90-day price trends. If this trend shows that the price of the fundamentally super strong stock has already corrected by about say 15%, the stock is already trading near its buy zone.

Why it is so? Because practically, fundamentally strong stocks do not correct a lot even during major corrections. Hence, a 15% decline is indicative of a level beyond which it is already poised to bounce back.

Price Trend Chart - 15,30-90D chart

In our example company, the price correction has still not started. Hence, it is better to wait before taking the final buy call.

#2. Fundamentally Strong or Weak?

By this time, the user will already know whether the stock is fundamentally strong or weak. The Stock Engine can also quantify the degree of fundamental strength possessed by a stock. It rates it in a scale of zero to five. Our example company has earned a fundamental strength score of 4.07.

Fundamentally Strong or Weak

There are five parameters based on which the Stock Engine evaluates the fundamental strength of a company (stock). The five parameters are growth, profitability, financial health, quality of management, and economic moat (competitive advantage).

To know how much the company has scored on each of these parameters, it is displayed on the Spider Diagram. In this diagram, the company is rated, for fundamentals, on a scale of 1 to 5 on each of these five parameters of business. Hover your cursor, in the app, on the spider diagram and it will show the ratings.

Fundamentally Strong or Weak - Spider diagram

#3. Price Valuation

By this stage, the user of the app is also aware of the price valuation of the stock. Like in our example stock, though its fundamentals were very strong, the price was very overvalued.

To get a deeper perspective on the price valuation aspect of the company, the users can scroll down in the app to the ‘Price Valuation’ section.

Again, the price valuation parameter of the stock is also quantified in two ways by the Stock Engine. First, it estimates the company’s (stock’s) intrinsic value. Second, it quantifies the price valuation factor on a scale of one to five. This kind of scaling highlights the degree of under or overvaluation.

Price Valuation - Score and Ratios

Our example company has earned a price valuation rating of 0.9 on a scale of 5. Hence, it is tagged as very overvalued. Compare its estimated intrinsic value (Rs. 487) with its current price (Rs. 2,578). You can see, the current price is almost 5 times its intrinsic value.

To get a more visual perspective of the price valuation aspect of the company, the app also provides a P/E chart. A rapidly rising P/E chart is an indicator of both, growth and possible overvaluation.

Price Valuation - PE Curve

#4. Profitability

One of the essential ingredients that make a company earn the tag of being fundamentally strong is its profitability. Our example company has already been tagged as fundamentally very strong. But let’s check how it fares in the profitability scores.

We need to just scroll down the page to the profitability section.

Profitability - Scores

The first line itself will declare in plain text if the company is a profitable company or not. Our example company is “very profitable.

The example company has earned a profitability score of 5 out of 5. This excellent rating is coming from the fact that its ROCE (Return on Capital Employed) is almost twice its WACC (Weighted Average Cost of Capital). Such companies are great value creators in the long term.

Other aspects of profitability are also checked before allocating the final score. Some key parameters that are checked are free cash flow, operating profit, and net profit (PAT).

#5. Growth

For a company to be tagged as fundamentally strong, it must first be profitable and also growing. Hence, the Stock Engine app evaluates the growth aspect of the stock carefully. Why carefully? Because when we see the past numbers, there are chances of overestimation. Similarly, a weak past must not weigh too much on the growth score. Hence, a variety of parameters are used to quantify the growth score. One such parameter is the sustainable growth score (SGR) and self-financeable growth (SFG).

To know about the growth score, scroll down in the app to the growth section.

Growth - Scores

The first line declares in plain text the status of the company with respect to its growth prospects. Our example company is “Fast Growing.” In the next line, the users can see the growth score. Our example company has earned a score of four out of five.

The score is allotted by inspecting the past numbers for reserves, operating revenue, profit, and cash flows. The algorithm of the app also used the factors like SGR and SFG to estimate the growth prospects of the company.

To give an idea of how all the fundamentals of the company are ultimately working to enhance the EPS of the stock, a chart shows the trend.

Growth - EPS chart

#6. Financial Health

Judging the overall financial health of a company is slightly more complicated than profitability and growth analysis. Hence, we decided to present the conclusions in plain text instead of throwing numbers or values at the users. The idea is to make users know, in an easy-to-understand way, in which areas the company is showing signs of good and poor health.

Financial Health

In the first line itself, the users will see a text declaration that highlights if the company is financially healthy or not. In the next line there will be the financial health score. Our example company has earned a health score of 3.65 out of five. Hence, the algorithm calls it as “strong” and not “very strong”.

The reason for a slightly lower rating can be found in the underlying parameters that build the health score.

  • Liquidity Analysis: Our example company was found to be sufficiently liquid. This analysis is done based on the current ratio, quick ratio, and cash ratio.
  • ROE Analysis: The ROE analysis is done by scrutinizing the absolute ROE number and its trend analysis. Our example company has a high ROE but it was not growing.
  • Debt Analysis: High debt makes a company risky. Hence, the debt analysis is done based on the debt-equity ratio, interest coverage ratio, debt vs cash analysis, etc. Our example company not only had low debt but was also reducing it over time.
  • ROCE: A company with a high return on employed capital is a healthy company. But here again, the user must also see the trend of ROCE. Though our example company has a high ROCE, over time, the ROCE is falling.

So there are a few reasons that made our example company financially strong but not super strong.

#7. Quality of Management

To judge the quality of the management of a company, the best way is to know who constitutes the board of directors and top managers. But unfortunately, as a small investment enthusiast, I do not have that access. Hence, I followed the bottom-up approach.

I asked myself, what are the performance indicators that highlight the quality of management? I found some and then I tried to quantify them for analysis and comparison.

Quality of Management - Scores

Here again, instead of throwing jargon at the users, the conclusions are written in plain text.

In the first line itself, the user will know if the quality of management is Good or not. Our example company’s management attained a tag of “Good”. It attained a quality score of 3.86 out of five.

The management’s quality analysis is done based on the following parameters:

Parameters
  • Operating Profit: One of the tasks of the management is to keep growing the operating profit of the company consistently with time. Our example company’s operating profit was growing, but it has seen dips in between.
  • EPS: EPS is a parameter that the shareholders (investors) follow very closely. Hence, for me, the management that keeps diluting the EPS should earn a low score. Our example company has seen consistent growth in EPS over the last few years.
  • Capital Utilization: When a company raises capital from investors in an IPO or from bonds etc, they do it with a purpose. The most common reason for capital raise is expansion and modernization. Again, when the company retains profits, it again does it for the same reasons and also for working capital management. The Stock Engine app checks if the capital raised by the company from its debtors and investors is meeting the purpose. Our example company scored only fair in this aspect.
  • Dividend: Dividend payment to shareholders is important. But if the management is just overdoing it, it is not quality governance. Hence, the Stock Engine app checks if the management is misleading the shareholders (about its cash position) by paying excessive dividends. Our example company can afford to pay the dividends it has paid in the past.

#8. Economic Moat

The Stock Engine app does a close analysis of the company’s economic moat (competitive advantage). But it is also true that judging a company for its moat only on the basis of the numbers it reports is not foolproof. Hence, I will accept that out of all the other algorithms, this one still needs a lot of work. Though I’m confident that the score that it is rendering now for the company is close to reality.

To know the company’s moat score and conclusion, one needs to scroll down to the Moat section of the app.

Moat - Score

Our example company earned a low moat score of 2.61 out of five. This is probably because there are other strong competitors operating in the same industry. Sometimes, a low moat score is also possible if the company does not have enough pricing power.

To make the moat of a company more visibly evident to the users, like other apps, the Stock Engine also presents it in a tabulated format. It makes the comparison easier. Moreover, in this one view, the users can compare the “Overall Score” of the best companies in the industry in one view.

Conclusion

As a user, suppose you are using Yahoo Finance to know about Reliance Industries. How easy it is to draw conclusions about the company using this app? I’m sure, a majority will tag it as non-conclusive. Though I’ll admit that the way the data of companies are presented in that app is impressive (especially its cash flow report). Then why do I say that is non-conclusive? Because it works just as a tool that reports the financial numbers of companies in a nice way.

It does calculations of a few key financial ratios. But can a beginner or a novice investor can draw conclusions from it? I believe the answer will be ‘no.’

This is where the Stock Engine app becomes useful. Though there is a clear disclaimer in its footer that says that the domain offers no investment advice, but its utility is evident.

Disclaimer

People can use the app to build a first impression about a company. Then, they can do their own research or approach their financial advisor to make the final buy or sell call.

The thing that makes this updated version of the Stock Engine more useful is its ability to enable its user to draw more inferences from its analysis.

There are hundreds of lines of code and logics that are used to compute the intrinsic value, overall score, other scores, and financial ratios. But they will have zero utility if the user of the app cannot interpret those numbers. We’ve developed this app with this objectivity in mind.

How many stock are there in the Stock Engine

[contact-form][contact-field label=”Name” type=”name” required=”true” /][contact-field label=”Email” type=”email” required=”true” /][contact-field label=”Website” type=”url” /][contact-field label=”Message” type=”textarea” /][/contact-form]

Free Cash Flow (FCF) – Formula, Calculation & Types


#1. What is Free Cash Flow? Definition and Purpose

Free cash flow (FCF) can be defined as the cash generated by a company’s operations after accounting for its capital expenditures (Capex). FCF represents the amount of cash available for distribution to investors, reinvestment in the business, or debt reduction (principal payment).

Free cash flow is really free cash available to the owners of the company. It is free because it has no immediate obligations.

Unlike net profit (PAT), free cash flow offers a more comprehensive but accurate measure of net profit. This net profit (FCF), which remains in the hands of the owners, is after accounting for all types of necessary and strategic expenses.

Before we see the formula and calculation part of FCF, I think, we should first know the types of FCF. Why? The ultimate objective of FCF analysis is to give oneself the ability to estimate the intrinsic value of a company. The steps to calculate the intrinsic value changes with the type of FCF we are considering.

Hence, let’s first know the types of FCF and then we’ll see the FCF formula.

(b) Types of Free Cash Flow

Broadly speaking, there are two types of people who have stakes in a company, borrowers and equity holders. The borrowers lend money (debt) for a fixed return called interest. Equity holders lend money for a stake in the company’s profits.

Free Cash Flow is free cash available for distribution to both borrowers and equity holders. 

There are two variations of FCF:

  • FCFF (Free Cash Flow To Firm): FCFF represents the cash flow available to all stakeholders of a company, including both equity shareholders and debt holders. It reflects the cash generated by the company’s operations that can be used for various purposes such as debt payments, reinvestment, or distribution to investors.
  • FCFE (Free Cash Flow To Equity): FCFE focuses specifically on the cash flow available to equity shareholders. It represents the portion of cash flow remaining after deducting interest payments, taxes, and other obligations owed to debt holders. FCFE is important for equity investors as it indicates the cash that can be distributed to shareholders in the form of dividends or reinvested in the company.

The mathematical difference between FCFF and FCFE can be seen in the below-represented formula:

FCFF and FCFE formula - relationship
A Comparison Table
Parameters FCFF FCFE
Term Free Cash Flow To Firm Free Cash Flow To Equity
Description It is free cash available for both borrowers and equity holders It is free cash available for equity holders (shareholders) only
Debt Consideration FCFF does not consider the effect of debt on the free cash available to the company. FCFE considers the effect of debt. It adds net debt and subtracts interest
Discount rate consideration while using DCF Model Weighted Average Cost of Capital (WACC = Cost of Debt + Cost of Equity) Only Cost of Equity (or return expectations of the shareholders)
Preference For… Both Debt Holders and Equity Holders (Shareholders) Equity Holders (Shareholders)

Now that we’ve understood that there are two types of FCF, let’s understand its application. First, we’ll look at the FCF formula.

(b) Calculation of Free Cash Flow

There are two ways to calculate the free cash flow of a company. First, by using the numbers in the cash flow reportSecond, from the balance sheet and profit and loss account.

Analysts prefer the use of the Cash Flow Report because it deals only in cash. Why? Because money taken from the cash flow report removes the account receivables as it is a non-cash item. Similarly, all non-cash expenses which are still not paid, or have been paid in advance, are removed.  As one is calculating the quantum of free cash flow, the use of the ‘net cash flow from operations’, which is the net of all non-cash items, looks more apt.

FCF from Cash Flow Report

Look into the cash flow report and all the numbers required to calculate FCF are neatly available. Hence, the best way is to download the cash flow statement from the company’s website, and then do the FCF calculation.

The first required number that we need for FCF calculation is net cash flow from operating activity. We’ll get this value ready-made from the cash flow report. In case you want to know how net cash flow from operating activities is arrived at, check the below infographics. You can also read this article for more details.

Calculate Free Cash Flow From Cash Flow Statement

The next step is to calculate the FCFF and FCFE using the below formulas:

FCFF and FCFE formula - Together

The value of Capex and the actual interest paid are clearly visible in the cash flow statement. Suggested Reading: How to read cash flow report.

In case, the available cash flow report is not as detailed, the balance sheet and P&L reports can be used to calculate FCF.

From Balance Sheet and P&L A/c

The below schematic representation highlights how to arrive at free cash flow (FCFF & FCFE) starting from the Net Profit (PAT) of the company.

Calculate Free Cash Flow From Balance Sheet & Income Statement

In terms of formula, FCFF and FCFE is represented as shown below:

FCFF = Net Income + Interest Expense x (1 – Tax Rate) + Depreciation & Amortization – Capital Expenditures – Changes in Working Capital

FCFE = FCFF – Interest Expense x (1 – Tax Rate) + Net Borrowing

Free Cash Flow FCFF FCFE Formula

FCFF includes the impact of both equity and debt financing, while FCFE focuses on the cash flow available to equity shareholders after considering the impact of debt. Both metrics provide insights into a company’s cash flow generation and can help investors assess the financial health and value of a company from different perspectives.

Components of FCF (Explained)

Allow me to explain each of the ingredients of the Free Cash Flow formula.

Net Profit (PAT)

PAT is the estimated income after adjusting all expenses. This expense includes mandatory depreciation and amortization, interest, and income tax.

There is a general perception that net profit is the profit of the owners. But in reality, it is not. To keep running a business profitable and growing, there are a few additional strategic expenses that must be accounted for.

Adjustment of all these strategic expenses, and non-cash transactions, gives the actual profit of the owners (FCFE), called free cash flow. Warren Buffett refers to FCFE as the Owner’s Income.

[The strategic expenses could be prepayment of debt, funding Capex, funding of the increase in working capital, etc.]

Depreciation & Amortisation (D&A)

This is a non-cash expense reported in the company’s income statement. It is the adjustment of Capital Expenditures (CAPEX) already made by the company in the past.

The depreciation visible in the financial report is just a number. The actual cash flow has already happened in the past. All of this cash outflow of the past was not accounted for in the same year of its occurrence. As per GAAP, the CAPEX can be adjusted, as depreciation cost, throughout the life of the new asset.

For example, an asset worth Rs.100 crore was purchased by the company. The payment of it (Rs.100 Cr) was made in the Year 2021. The life of the purchased asset is say 8 years. So the company can book the total CAPEX in all of the next 8 years. Hence, in Yr-2022 it will book depreciation of Rs.12.5 crore. The same will be repeated for the next 7 years. At the end of the eighth year, the full cost of the asset would have been adjusted (12.5. x 8 = 100).

As depreciation is a non-cash expense, hence in the estimation of free cash flow, we can add this expense back to PAT. It then represents the actual cash available in the hands of the company.

Interest Expense

In FCFF, we are calculating the free cash flow available to all types of investors of the company, the borrowers, and the shareholder (equity holders). Hence, the effect of debt is not taken into consideration here.

How does debt affect the company? In four ways:

  • Increase in cash flow,
  • Increase in interest expense,
  • Tax savings due to interest paid,
  • Increase in liability to pay back the principal.

In the calculation of FCFF, the four effects of debt are not considered. Why? Because FCFF is the quantum of free cash available with the company before the debt is served.

Suppose a company makes Rs.100 crore as FCFF. This is the money available to serve the interest of both shareholders and lenders. Now, suppose the company pays the following debt-related payments (a) Rs.10 crore of interest and (b) Rs.8 crore as principal. After payment of this liability, the amount of FCF left with the company is Rs.82 crore (=100-10-8), it is the FCFE.

Increase in Working Capital

Let’s first know about the components of working capital. To know about working capital in detail check the provided link.

  • Current Asset (CA): Total liquid assets which can be converted into cash in the next year. Example of such assets is account receivables, raw material, work in progress, finished good inventory, pre-paid liability (advance), savings deposits, etc.
  • Current Liability (CL): Total liability that must be paid in the next year. Example of such liability is account payables, interest dues, income tax dues, short-term debts, etc.

Working Capital (WC) = CA – CL

Significance of Working Capital:

Suppose, a hypothetical company ABC reported Rs.100 Cr in the current asset (CA) in FY2022. The company also reported an immediate obligation of Rs.75 Cr as its current liability (CL). It means, out of the available Rs.100 Cr, Rs.75 Cr is already booked to handle current liabilities for the past year 2022. Hence, what is available for the year 2023 is only Rs.25 Cr.

WC (Rs.25 Cr) = CA (Rs.100 Cr) – CL (Rs.75 Cr)

This Rs.25 Cr is what we call working capital. This is the net available fund generated by the company’s operations in the year 2022, that can be used to fund the operational needs in the year 2023.

Suppose there is another hypothetical company XYZ which reported Rs.120 Cr. in the current asset (CA) in FY2022, and Rs.130 Cr in current liability (CL). As CL is more than CA, hence its working capital will be negative.

WC (-Rs.10 Cr) = CA (Rs.120 Cr) – CL (Rs.130 Cr)

Negative working capital means, in 2022 the company has not generated enough cash to fund its current liabilities. As a result, for 2023 the company starts with zero WC.

Moreover, in 12023 it must also ensure enough current assets to take care of the current liability deficit for 2022 and to meet the forthcoming current liabilities requirement for 2023.

Effects of Change in WC on FCF

How does change in WC (year on year), affect the company’s Free Cash Flow?

  • An increase in WC is Positive: it is an indication that the company wants to keep more liquid assets for its forthcoming operation needs. Hence, this amount is deducted from the reported PAT. Hence, it reduced the FCF.
  • An increase in WC is negative: it is an indication that the company wants to keep fewer liquid assets for its forthcoming operation needs. Hence, this amount gets added to the reported PAT. Hence, it increases the FCF.

5. Capital Expenditure (CAPEX)

Capex is the money that a company has spent to expand & upgrade its asset base. In this process, they either buy new assets (expansion) or enhance the capability of their existing assets (modernization).

CAPEX is also an expense for the company. But the way Capex is reported in financial statements is different from other expenses. Normally, all expenses are reported in the company’s P&L A/c as it is booked. But CAPEX cost is booked in a staggered way, as depreciation, throughout the life of the asset.

If one does not have access to the company’s cash flow report, CAPEX can also be calculated from the numbers published in the balance sheet. We can use the below formula to calculate CAPEX:

Free Cash Flow - Capex Formula

6. Debt & Its Effect

Debt plays a significant role in the calculation of both FCFE and FCFF. Here’s how it affects each metric:

  1. FCFE (Free Cash Flow to Equity): Debt has a direct impact on FCFE. When a company has debt, it incurs interest expenses on that debt. These interest expenses represent the cost of borrowing money. In the FCFE calculation, we subtract the interest expense from FCFF to determine the cash flow available specifically to equity shareholders.

The effect of debt on the shareholders is depicted in the below infographics:

Effect on cash due to debt for shareholders

If a company has higher levels of debt, it means that it has more interest expenses to pay. Consequently, a larger portion of the cash flow generated by the company will be allocated to interest payments, reducing the amount available to be distributed to equity shareholders. Therefore, higher debt levels generally result in a lower FCFE, as more cash is directed toward servicing the debt.

  1. FCFF (Free Cash Flow to the Firm): Debt also affects FCFF “indirectly.” FCFF represents the cash flow available to all stakeholders, including equity shareholders and debt holders. When a company has debt, it incurs interest expenses that need to be paid to debt holders.

The presence of debt increases the company’s overall financial obligations, including interest payments and principal repayments. These obligations are deducted from the cash flow generated by the company to arrive at FCFF. As a result, higher levels of debt can reduce the FCFF since a portion of the cash flow is allocated toward debt-related obligations.

Debt has an impact on both FCFE and FCFF. In the case of FCFE, higher debt levels lead to lower cash flow available to equity shareholders after accounting for interest expenses. For FCFF, debt increases the company’s financial obligations, which reduces the overall cash flow available to all stakeholders.

#3. Why Free Cash Flow and Not PAT

In intrinsic value estimation, experts prefer the use of Free Cash Flow instead of PAT. Why? Because free cash flow is a more accurate representation of cash profits available in the hands of the owners.

While net profit (PAT) is a commonly used metric, it can be misleading due to various accounting treatments and non-cash items.

Free cash flow, on the other hand, provides a clearer picture of a company’s financial health by focusing on the actual cash generated.

It accounts for changes in working capital, capital expenditures, and other factors that impact cash flow.

#4. Example: Free Cash Flow Calculation

In this example, we will use an example stock Reliance Industries (RIL), and calculate its free cash flow. First, we will collect the numbers from its financial statement. I’ve used the database of money control to fetch the data for RIL.

Free Cash Flow - RIL Calculation Example

Free Cash Flow (FCF) calculation is done using this formula:

Free Cash Flow FCFF FCFE Formula

FCFF = (PAT + D&A + Interest) – (Capex + Inc. in WC)

FCFE = FCFF + New Debt – Interest * (1-TaxRate)

FCFE = (PAT + D&A + New Debt + Interest*TaxRate) – (Capex + Inc. in WAC)

  • PAT = 35,163
  • D&A = 10,558
  • New Debt = 60,360
  • Interest*TaxRate = Zero (say)
  • Capex = 24,856
  • Inc. in WC = 17,641

FCFE = (35,163 + 10,558 + 60,360) – (24,856 + 17,641)

FCFE = 63,584

#5. Warren Buffett’s Perspective on Free Cash Flow

Warren Buffett places great importance on free cash flow in his investment approach. Here’s an explanation of Warren Buffett’s perspective on free cash flow:

  1. Focus on Cash Flow: Warren Buffett believes that cash flow is a crucial indicator of a company’s financial strength. He pays close attention to the cash a company generates from its operations. It represents the true measure of its ability to generate profits and sustain its business.
  2. Sustainable Cash Generation: Buffett emphasizes the importance of sustainable cash flow generation. He looks for companies that consistently generate free cash flow. It highlights their ability to generate surplus cash even after meeting all necessary expenses, including reinvestment requirements.
  3. Long-Term Forecasting: Buffett incorporates free cash flow analysis into his long-term forecasting. By evaluating a company’s historical and projected free cash flow, he aims to assess its long-term earning potential and its ability to generate value over time.
  4. Capital Allocation: Buffett considers free cash flow in assessing a company’s capital allocation decisions. He looks for management teams that allocate capital wisely. He likes management that uses excess cash to invest in growth opportunities, make strategic acquisitions, or return value to shareholders through dividends and share buybacks.

Buffett’s investment strategy is rooted in value investing, which involves identifying companies with intrinsic value that exceeds their market price. Free cash flow analysis helps him assess the intrinsic value of a company by considering the present value of its future cash flows

Conclusion

Free cash flow is a vital metric that offers valuable insights into a company’s financial health, viability, and potential for generating shareholder value. By understanding the concept, calculating it accurately, and considering its role in valuation, investors can make more informed investment decisions. Free cash flow analysis provides a robust framework for evaluating companies and assessing their ability to generate sustainable cash flows, ultimately contributing to long-term investment success.

Free Cash Flow (FCF) – Formula, Calculation & Types

[contact-form][contact-field label=”Name” type=”name” required=”true” /][contact-field label=”Email” type=”email” required=”true” /][contact-field label=”Website” type=”url” /][contact-field label=”Message” type=”textarea” /][/contact-form]

The Urgent Need For Personal Finance Education For Kids


Personal finance education for kids is a way of building strong foundations for financial well-being that can last a lifetime. Teaching children about budgeting, saving, investing, and responsible spending from an early age, can empower them with the tools to make informed financial decisions. This knowledge enhances critical thinking skills, fosters goal-setting abilities, and instills a sense of financial responsibility.

With practical application and involvement from parents and caregivers, it is possible to create a change. The change will make the whole generation that is financially literate, confident, and capable of navigating the complexities of the financial world.

In today’s complex and ever-changing world, personal finance skills are crucial for navigating the intricacies of our financial lives. Yet, there is a prevailing gap in financial knowledge among individuals. It leads to poor financial decisions, debt burdens, and a lack of financial independence and security.

To address this issue, it is imperative that we incorporate personal finance education in the early years of schooling. By equipping children with the necessary tools and knowledge from a young age, we can empower them to make informed financial choices and foster a financially literate society.

Let’s know more about it.


Teach Kids Personal Finance - image

Understanding the Benefits

The benefits of personal finance education for kids, in the early years, extend far beyond mere theoretical knowledge. Research has consistently shown that individuals who receive financial education early in life demonstrate improved financial behaviors and decision-making skills.

Introducing the following concepts is necessary.

By making them aware of these concepts, we can instill positive financial habits that last a lifetime. Moreover, personal finance education enhances critical thinking, problem-solving, and numeracy skills, which are transferable to various aspects of life.

Children learn to set and manage goals effectively, develop a sense of delayed gratification, and comprehend the consequences of financial choices. These skills are invaluable as they transition into adulthood, where financial independence and responsibility become paramount.

Practical Implementation

To ensure the effectiveness of personal finance education, it is essential to design a comprehensive and age-appropriate curriculum.

The curriculum should cover a range of topics which includes the following:

By progressively introducing these concepts throughout different grade levels, we can build a solid foundation of financial literacy.

Practical application is key to reinforcing the lessons learned. Simulations, interactive exercises, and real-world case studies can be incorporated into the curriculum to provide hands-on experience. Partnering with financial institutions, educators, and experts in the field can also enrich the learning process by bringing in practical insights and diverse perspectives.

Furthermore, involving parents and caregivers in the financial education journey can create a holistic approach. By engaging families in conversations about money management, saving, and responsible spending, we establish a support system that reinforces the principles taught in schools.

Collaboration between schools, families, and the wider community is pivotal in creating a culture of financial literacy and empowerment.

Societal Impact

The impact of personal finance education extends beyond individuals. A financially literate society benefits communities, economies, and future generations.

Financially educated individuals are less likely to fall into debt traps, more likely to contribute to economic growth, and better equipped to handle financial emergencies.

Moreover, by breaking the cycle of poor financial decision-making, we reduce the burden on social welfare systems and promote financial independence.

A Story (For Motivation)

Once upon a time, in a small town, there lived a young boy named Jai. Jai was fortunate to attend a school that believed in the power of financial literacy. From a young age, he learned the value of money, the importance of saving, and the basics of investing.

As Jai grew older, his financial knowledge became a guiding light in his life. While his friends spent their allowances on instant gratification, Jai carefully budgeted and saved. He started a small business selling handmade crafts and managed his profits wisely, reinvesting in his budding venture.

As time went on, Jai’s financial literacy skills flourished. He discovered the power of compounding, and with patience and strategic investments, his wealth steadily grew. He continued to expand his business, creating job opportunities for others in his community.

But Jai’s impact went beyond his personal success. He recognized the financial struggles faced by many in the town, particularly the underprivileged children who lacked access to education and opportunities. Motivated by a desire to make a difference, Jai used his financial knowledge to initiate a financial literacy program in his school.

Through workshops, mentorship, and engaging activities, Jai shared his expertise with his peers. He taught them about budgeting, saving, and investing, empowering them with the tools to take control of their financial futures. As word spread, the program gained momentum, and soon neighboring schools joined in, creating a ripple effect of financial literacy throughout the town.

The Impact

The impact of Jai’s efforts began to show. The children who participated in the program became more financially responsible. They understood the value of money and made informed decisions about spending and saving. As they grew older, they pursued higher education, started businesses, and became financially independent individuals who could contribute positively to society.

Beyond personal transformations, Jai’s financial literacy program sparked a shift in the community as a whole. His town became known for its financial awareness, attracting businesses and investments that fueled economic growth. The town flourished, with more job opportunities, improved infrastructure, and a higher quality of life for its residents.

Jai’s story spread far and wide, inspiring other communities to prioritize financial literacy for their youth. His dedication and vision set off a chain reaction, transforming society one financially literate child at a time.

And so, Jai’s legacy lived on, reminding us that a financially literate child can make a profound difference not only in their own life but also in the society in which they live.


Conclusion

In a world hungry for change, where financial hardships often hold individuals and communities hostage, the power of financial literacy in the hands of a child shines like a beacon of hope.

As we witness the transformation of young minds equipped with the knowledge and skills to navigate the complexities of money, we realize that the impact reaches far beyond personal gains.

It extends to the very fabric of our society, weaving a tapestry of empowered individuals, thriving communities, and a future brimming with possibilities.

Let us embrace the vision of a financially literate generation, for in their hands lies the power to create a brighter, equitable, and prosperous world for all.

The Urgent Need For Personal Finance Education For Kids

[contact-form][contact-field label=”Name” type=”name” required=”true” /][contact-field label=”Email” type=”email” required=”true” /][contact-field label=”Website” type=”url” /][contact-field label=”Message” type=”textarea” /][/contact-form]

Price to Free Cash Flow (P/FCF) Ratio


The Price to Free Cash Flow (P/FCF) ratio is a valuation metric that compares a company’s stock price to its free cash flow. By dividing the stock price by the free cash flow per share, the P/FCF ratio provides insight into how much investors are willing to pay for each unit of cash generated by the company. A lower P/FCF ratio suggests that the stock may be undervalued, while a higher ratio may indicate overvaluation. It is a valuable tool for evaluating a company’s cash flow efficiency and potential investment value.

Introduction

Valuation ratios are key tools used in stock analysis to assess the relative value of a company’s stock. They provide a quantitative measure of a stock’s price in relation to various financial indicators such as earnings, cash flow, or book value. By comparing these ratios to industry benchmarks or historical values, investors can gauge whether a stock is undervalued or overvalued.

But using multiple valuation metrics is crucial in assessing a stock’s value. Different ratios provide different perspectives on a company’s financial health and market perception. Relying on a single metric may overlook important factors or introduce biases. By considering a range of valuation ratios, investors can gain a more comprehensive understanding of a stock’s valuation and make more informed investment decisions.

The Price to Free Cash Flow (P/FCF) ratio is a valuation metric that compares a company’s stock price to its free cash flow. It offers insight into how the market values a company’s stock relative to the cash it generates after accounting for operating expenses and capital expenditures. By dividing the stock price by the free cash flow per share, the P/FCF ratio helps investors assess whether a stock is trading at a premium or discount based on its cash flow generation. This ratio is particularly useful in evaluating a company’s ability to generate and manage its cash flow efficiently.

Let’s read more about it.


Understanding Free Cash Flow (FCF)

Free cash flow (FCF) represents the cash generated by a company after accounting for operating expenses and capital expenditures. It is a crucial measure of a company’s cash generation potential as it reflects the amount of cash available for various purposes. The purpose could be like reinvesting in the business, paying dividends, reducing debt, or pursuing growth opportunities.

FCF is calculated by subtracting capital expenditures (such as investments in property, plant, and equipment) from the operating cash flow (the cash generated from core business operations). It provides a clearer picture of a company’s financial health than other metrics like net income, as it focuses on the actual cash available to the company. Read more about free cash flow (FCF) here.

Price to Free Cash Flow (P:FCF) Ratio - FCF representation

The significance of FCF lies in its ability to indicate whether a company is generating sufficient cash to support its operations and growth initiatives.

  • Positive FCF suggests that the company has surplus cash, which can be used for expansion, debt reduction, or rewarding shareholders.
  • On the other hand, a negative FCF could indicate that the company is struggling to generate enough cash to meet its financial obligations.

Price to Free Cash Flow (P/FCF) Ratio

The Price to Free Cash Flow (P/FCF) ratio is a valuation metric that compares a company’s stock price to its free cash flow. It provides insight into how much investors are willing to pay for each unit of free cash generated by the company.

The Formula

The calculation of the P/FCF ratio is relatively straightforward. It involves dividing the market price per share of the company’s stock by its free cash flow per share. The formula is as follows:

Price to Free Cash Flow (P:FCF) Ratio - Formula

The stock price per share can be obtained from the market, while the free cash flow per share is calculated by dividing the total free cash flow generated by the company by the number of outstanding shares.

For example, if a company has a stock price of Rs.50 per share and generates a free cash flow of Rs.2 per share, the P/FCF ratio would be 25 (calculated as 50 / 2). This means that investors are paying 25 times the company’s free cash flow for each share they purchase.

A comparison of the P/FCF ratio of a company to its industry peers or historical values is useful. This way, the investors can assess whether the stock is trading at a premium or discount relative to its free cash flow generation. A lower P/FCF ratio suggests the stock may be undervalued, while a higher ratio may indicate overvaluation.

Why P/FCF ratio analysis is important

The rationale behind using the Price to Free Cash Flow (P/FCF) ratio as a valuation metric is justified. It stems from the importance of cash flow in assessing a company’s financial health and investment potential. Here are a few key reasons why the P/FCF ratio is commonly used:

Reasons

  1. Focus on Cash Flow: Unlike other financial metrics such as income or PAT, the P/FCF ratio directly considers the company’s ability to generate cash. Cash flow is a vital indicator of a company’s financial strength. It reflects its actual cash-generating capability and liquidity.
  2. Cash Availability: Free cash flow represents the cash available after covering operational expenses and capital expenditures. It provides insight into the funds a company can use for various purposes. Such as reinvesting in the business, paying dividends, reducing debt, or pursuing growth opportunities. The P/FCF ratio allows investors to assess the value placed on this available cash.
  3. Flexibility and Stability: Cash flow is often considered more stable and reliable than other financial metrics. Why? Because it is less susceptible to accounting adjustments or non-cash items. The P/FCF ratio helps investors gauge the stability and flexibility of a company’s cash flow generation.
  4. Future Growth Potential: Evaluating a company’s valuation based on its free cash flow allows investors to consider the potential for future growth. A higher free cash flow may indicate a company’s capacity to invest in the business. The investment can be in R&D, expanding operations, or pursuing acquisitions. This in turn will drive future income and profits.
  5. Comparison with Peers: A comparison of a company’s P/FCF ratio to its industry peers or historical values is helpful. It can help identify relative strengths and weaknesses. It provides a benchmark for assessing whether a stock trades at a premium or discount compared to similar companies in the same industry.

The Market Likes Company’s Cash Flow Generation Ability

The Price to Free Cash Flow (P/FCF) ratio relates to the concept of cash flow and market value. It provides insight into how the market values a company’s cash flow generation. Here’s how it connects to these concepts:

  1. Cash Flow: The P/FCF ratio directly incorporates the company’s cash flow into the valuation process. The P/FCF ratio highlights the relationship between the company’s cash flow and its market value.
  2. Market Value: The P/FCF ratio reflects the market’s perception of a company’s cash flow potential and its willingness to pay for that cash flow. A higher P/FCF ratio suggests that the market values the company’s cash flow at a premium. It indicates an optimistic view of the company’s prospects. Conversely, a lower P/FCF ratio may imply that the market values the company’s cash flow at a discount.

Interpreting the P/FCF Ratio

Interpreting the Price to Free Cash Flow (P/FCF) ratio in terms of stock valuation involves assessing whether the ratio indicates undervaluation or overvaluation. Here’s how to interpret the P/FCF ratio:

  1. Lower P/FCF Ratio (Undervaluation): A lower P/FCF ratio suggests that investors are paying less for each unit of free cash flow generated by the company. This may indicate a potential undervaluation of the stock. It could imply that the stock is priced attractively compared to the cash flow it generates. Such a stock presents an opportunity for investors to consider purchasing the stock.
  2. Higher P/FCF Ratio (Overvaluation): Conversely, a higher P/FCF ratio may indicate that investors are paying a higher premium for each unit of free cash flow. This could imply the potential overvaluation of the stock. It suggests that the market is valuing the company’s cash flow at a higher multiple. This can possibly exceed what is considered reasonable based on the company’s financial performance. In such cases, investors may want to exercise caution or consider the potential risks associated with an overvalued stock.

It’s important to note that the interpretation of the P/FCF ratio should consider other factors. The factors could be industry norms, growth prospects, and overall market conditions. Comparing the P/FCF ratio to industry peers and historical values provides additional context for a more accurate interpretation.

For a comprehensive valuation analysis, it is recommended to use the P/FCF ratio in conjunction with other valuation metrics, such as:

A holistic approach that combines multiple metrics helps to paint a more complete picture of the stock’s valuation and assists in making informed investment decisions.

Low Vs High P/FCF Ratio

A low Price to Free Cash Flow (P/FCF) ratio suggests the possible undervaluation of a stock. While a high P/FCF ratio indicates possible overvaluation. Here are the implications of each scenario:

  1. Low P/FCF Ratio (Possible Undervaluation):
    • Investment Opportunity: A low P/FCF ratio may indicate that the stock is priced attractively relative to its FCF generation. It suggests that investors are currently paying less for each unit of cash flow the company generates. This could present an investment opportunity, as the stock may have the potential for future price appreciation.
    • Market Misjudgment: A low P/FCF ratio could suggest that the market may be underestimating the company’s growth prospects, financial stability, or future cash flow potential.
  2. High P/FCF Ratio (Possible Overvaluation):
    • Risk of Overpaying: A high P/FCF ratio indicates that investors are paying unreasonably higher premiums for each unit of FCF It suggests that the stock may be priced above its reasonable valuation based on its cash flow generation.
    • Expectations and Growth Outlook: A high P/FCF ratio could imply that the market has high expectations for the company’s future growth or cash flow prospects. It may suggest that investors are willing to pay a premium due to the anticipation of strong future earnings and cash flow expansion. However, there is a risk that the company may not meet these lofty expectations.
    • Caution Required: Investors should exercise caution when faced with a high P/FCF ratio. It is crucial to thoroughly evaluate the company.

Industry & Peer Comparison of P/FCF

Comparing the Price to Free Cash Flow (P/FCF) ratio against industry peers and historical values is crucial. It will give a better context and understanding of a company’s valuation. Here’s why this comparison is important:

  1. Industry Comparison: Different industries have varying norms and dynamics, including variations in capital intensity, growth rates, and profitability. Comparing a company’s P/FCF ratio to its industry peers helps to assess its relative valuation within the specific industry. If a company’s P/FCF ratio is significantly higher or lower than its peers, it may indicate a potential overvaluation or undervaluation, respectively. Understanding industry benchmarks is essential for accurate valuation analysis.
  2. Relative Performance: Examining a company’s P/FCF ratio over time allows for comparison against its own historical values. By assessing changes in the ratio, investors can gauge the company’s financial performance. This way it is easy to judge if the valuation has become more attractive or less favorable. It helps identify trends and potential deviations from historical norms. It provides insights into a company’s financial health and trajectory.
  3. Identification of Outliers: Comparing the P/FCF ratio against industry peers and historical values can help identify outliers. These are companies that significantly deviate from the norm. Outliers may indicate unique characteristics, such as superior cash flow generation, market expectations, or potential concerns. Identifying these outliers prompts further investigation and analysis to understand the underlying reasons for the deviation.
  4. Valuation Range: Industry peers and historical values provide a range of P/FCF ratios against which a company’s valuation can be assessed. This range helps investors assess whether a stock’s P/FCF ratio is within a reasonable range. It adds a benchmark for evaluating the stock’s valuation.

Pros and Cons of Using (P/FCF) Ratio

Using the Price to Free Cash Flow (P/FCF) ratio as a valuation metric has its pros and cons. Let’s explore them:

  1. Focus on Cash Flow: The P/FCF ratio considers a company’s cash flow. FCF is a critical indicator of its financial health and ability to generate real cash. It provides a clearer picture of a company’s financial performance than metrics based on accounting earnings alone.
  2. Relative Valuation: The P/FCF ratio allows for easy comparison of a company’s valuation to industry peers or historical values. This relative valuation approach provides context and helps identify potential undervaluation or overvaluation of a stock.
  3. Cash Flow Perspective: By incorporating cash flow, the P/FCF ratio provides insights into a company’s ability to grow. FCF can fund operations, invest in growth, pay dividends, reduce debt, and withstand economic downturns. It highlights the actual cash available to the company for various purposes.
  4. Stability and Flexibility: Cash flow is generally considered a more stable and reliable measure than earnings. It is less prone to manipulation or accounting distortions. The P/FCF ratio, therefore, provides a more stable basis for valuation and analysis.

  1. Limited Focus: The P/FCF ratio focuses solely on the cash flow aspect. It does not consider other fundamental factors such as growth prospects, industry dynamics, competitive advantage, or qualitative aspects of the business. Hence, it should be used in conjunction with other metrics to gain a comprehensive understanding of a company’s value.
  2. Variability in Cash Flow: Cash flow can fluctuate significantly from year to year. It is especially true for companies operating in a cyclical industry. Relying solely on the P/FCF ratio may not capture this cyclical nature of business.
  3. Industry-Specific Considerations: Different industries have varying capital requirements, growth rates, and cash flow characteristics. Comparing P/FCF ratios across industries may not provide an accurate assessment.
  4. Ignoring Debt and Capital Structure: The P/FCF ratio does not explicitly account for a company’s debt levels or its capital structure. This omission may overlook important factors that affect a company’s financial health and risk profile.

Comparison Between P/E and P/FCF Ratio

Both P/E and P/FCF ratios are valuable valuation ratios. But their effectiveness can vary depending on the specific circumstances and objectives of the investment expert. Here’s a comparison to help you understand their relative effectiveness:

Comparison

P/E Ratio: The P/E ratio is widely used and well-known in the investment community. It compares a company’s stock price to its earnings per share (EPS).

  1. Pros: The P/E ratio is simple to calculate, readily available, and provides insights into the market’s valuation. It is particularly useful for assessing profitability and growth potential.
  2. Cons: The P/E ratio relies on reported earnings (PAT). The PAT can be subject to accounting adjustments and one-time events. It may not capture the complete picture of a company’s financial health. It is especially true for companies with irregular earnings or high capital expenditure requirements.

P/FCF Ratio: The P/FCF ratio compares a company’s stock price to its free cash flow per share, which represents the cash available after accounting for operating expenses and capital expenditures.

  1. Pros: The P/FCF ratio focuses on cash flow. FCF is a more stable indicator of a company’s financial performance. It provides insights into a company’s ability to generate cash, invest in growth, and pay dividends.
  2. Cons: The P/FCF ratio may not capture growth opportunities or qualitative aspects of a business. It does not consider a company’s debt levels or capital structure explicitly.

My take

The choice between P/E and P/FCF ratios depends on the investor’s priority. If the investor prioritizes profitability and growth potential, the P/E ratio may be more effective. However, if the investor is focused on cash flow generation and financial stability, the P/FCF ratio may be a more suitable metric.

In practice, investment experts often use both ratios in conjunction with other valuation metrics. The other valuation metric that uses FCF more holistically is discounted cash flow (DCF) analysis. It gives a more comprehensive understanding of a company’s valuation.

Case Study and Examples

Here are two real-world examples of how the Price to Free Cash Flow (P/FCF) ratio can be applied to evaluate stock valuations:

For Example

  1. Reliance Industries Limited (NSE: RELIANCE):
    • As of the current date, let’s assume Reliance Industries has a stock price of Rs.2,500 per share and an annual FCF of Rs.50 per share (assuming).
    • Calculating the P/FCF ratio: P/FCF = Stock Price / Free Cash Flow = 2500 / 50 = 50.
    • Interpreting the result: A P/FCF ratio of 50 suggests that investors are willing to pay 40 times the annual FCF generated by RIL. This ratio indicates the market’s valuation of the company’s cash flow relative to its stock price.
    • Comparison: To assess whether the stock is undervalued or overvalued, let’s compare it to the P/FCF ratio of its industry peers or historical values. Let’s say the industry average P/FCF ratio is 35. A P/FCF ratio of 50 may suggest potential overvaluation.
  2. HDFC Bank Limited (NSE: HDFCBANK):
    • Assuming HDFC Bank has a stock price of INR 1,500 per share and an annual free cash flow of INR 75 per share (assuming).
    • P/FCF calculation: P/FCF = 1500 / 75 = 20.
    • Interpretation: With a P/FCF ratio of 20, investors are willing to pay 20 times the FCF.
    • Comparison: If the industry average P/FCF ratio is 25, a P/FCF ratio of 20 may indicate potential undervaluation.

Example of Comparison Method

Comparing and contrasting the Price to Free Cash Flow (P/FCF) ratios of different Indian companies or industries can showcase the utility of this valuation metric. Here’s an example:

Two Industries For Example

  1. Information Technology Industry:
    • TCS: Assume TCS has a P/FCF ratio of 30.
    • Infosys: Assume Infosys has a P/FCF ratio of 25.
    • Wipro: Assume Wipro has a P/FCF ratio of 20.
    • Interpretation: In this scenario, the P/FCF ratios of the three major IT companies indicate varying market valuations of their cash flow generation. TCS has a higher P/FCF ratio of 30. It suggests that the market is willing to pay a higher premium for each unit of its free cash flow. Wipro, with a lower P/FCF ratio of 20, indicates a comparatively lower valuation. The varying ratios reflect differences in how the market perceives the company’s current and future prospects.
  2. Banking Industry:
    • HDFC Bank: Assume HDFC Bank has a P/FCF ratio of 25.
    • ICICI Bank: Assume ICICI Bank has a P/FCF ratio of 15.
    • Axis Bank: Assume Axis Bank has a P/FCF ratio of 18.
    • Interpretation: Comparing the P/FCF ratios of these banks, HDFC Bank has a relatively higher P/FCF ratio of 25. ICICI Bank and Axis Bank have lower ratios of 15 and 18, respectively. It suggests a higher valuation for HDFC and a lower for ICICI and Axis.

By comparing the P/FCF ratios of different companies within an industry, investors can gain good insights. They will know how the market values the cash flow generation. This way the investors can easily make relative assessments of valuations.

Conclusion

The P/FCF ratio serves as a valuable valuation metric for investors seeking to evaluate stock prices relative to a company’s FCF.

Throughout this article, we explored the significance of the P/FCF ratio in assessing stock valuations. We highlighted its calculation, rationale, and interpretation. This article is emphasizing the importance of comparing it against industry peers and historical values for better context.

We discussed how the P/FCF ratio relates to the concepts of cash flow and market value. It highlights its focus on cash flow and its ability to provide insights into a company’s cash generation potential. Additionally, we highlighted the pros and cons of using the P/FCF ratio. We’ve acknowledged its strengths in focusing on actual cash flow and facilitating relative valuations. We have also recognized its limitations in isolation.

It was emphasized that the P/FCF ratio should not be used in isolation but rather in conjunction with other fundamental analysis tools. By combining the P/FCF ratio with qualitative assessments, financial statements, growth prospects, and industry dynamics, investors can form a more comprehensive evaluation of a company’s value.

We encourage readers to consider the P/FCF ratio as a valuable tool in their stock evaluation process. By incorporating it alongside other fundamental analysis tools, investors can gain a deeper understanding of a company’s financial health. A holistic approach will enable informed investment decisions and help navigate the complexities of the stock market.

Price to Free Cash Flow (P/FCF) Ratio

[contact-form][contact-field label=”Name” type=”name” required=”true” /][contact-field label=”Email” type=”email” required=”true” /][contact-field label=”Website” type=”url” /][contact-field label=”Message” type=”textarea” /][/contact-form]

Understanding Operating Profit: A Key Metric for Assessing Business Performance


In the realm of financial analysis, understanding operating profit is crucial. It serves as a key measure of a company’s operational efficiency and profitability. However, it is essential to grasp its limitations and consider it in conjunction with other metrics. This article explores the significance of operating profit, its components, calculation, and interpretation. It will provide a comprehensive understanding of its role in assessing a company’s financial health.

Operating profit is a key financial metric that evaluates a company’s profitability. The profit considered for evaluation is solely from its core operations. It excludes all non-operating activities. Operating profit provides insights into the efficiency of a company’s day-to-day core business activities.

Operating profit holds significance for investors, analysts, and business owners. It provides valuable insights into the operational efficiency and profitability of the core business activities.

By focusing on operating profit, analysts can assess how well a company generates profits from its fundamental operations. Operating profit does not consider “other incomes” and “non-operating expenses” like interest income, income from investments, taxes, or one-time events.

Operating profit allows for a clearer understanding of the company’s ability to sustain profitability and growth over time.

This article will provide a comprehensive understanding of operating profit. It’ll explore its components, calculation methods, and interpretation. Let’s start exploring.


#1. Definition and Purpose of Operating Profit

Definition: Operating profit refers to the profit generated by a company from its core operations, excluding non-operating activities. It represents the amount of operating revenue remaining after deducting the cost of goods sold (COGS) and operating expenses.

The Purpose

  • In business: The purpose of operating profit is to assess the profitability and efficiency of the company’s core activities. It indicates how well a company generates profits from its day-to-day operations. Why do businesses focus on operating profit? This way they can evaluate their operational performance and identify areas for cost improvement. This awareness will let them make informed decisions regarding pricing and cost management.
  • In accounting: It enables investors and analysts to assess the financial health and profitability of a company’s core business activities. Operating profit is not influenced by non-operating factors such as interest income, investment income or loss, or tax implications. Hence, analysts can compare it across companies and industries as it focuses on the income generated directly from operations.

#2. Gross Profit, Operating Profit, and Net Profit

Operating profit, gross profit, and net profit are all profitability measures. But they differ in terms of what they include and how they assess a company’s financial performance. Here’s a comparison of the three measures:

Profitability Measure Definition Components Included
Gross Profit Operating Revenue minus the cost of goods sold (COGS) Operating, COGS
Operating Profit Operating Revenue minus COGS and other operating expenses Operating Revenue, COGS, other Operating Expenses
Net Profit Total Income (operating revenue plus other income) minus COGS, operating expenses, interest, taxes, and non-operating items Total Income, COGS, Operating Expenses, Interest Expenses, Taxes, Non-operating Items
Explanation
  1. Gross Profit:
    • Gross profit represents the operating revenue remaining after deducting the direct cost of producing goods or services (cost of goods sold – COGS).
    • It focuses solely on production costs. It does not include operating expenses such as marketing, R&D, and administrative costs.
  2. Operating Profit:
  3. Net Profit:

Gross profit focuses solely on production costs. Operating profit considers both production costs and other operating expenses. While net profit encompasses all types of income and expenses.

Each measure provides a different perspective on a company’s profitability and financial performance. Operating profit offers a more focused view of the operational efficiency and effectiveness of the company’s core business.

#3. Importance of Operating Profit

Focusing on operating profit is crucial when evaluating a company’s operational efficiency for several reasons:

  1. Core Business Evaluation: Operating profit excludes non-operating factors and focuses only on core operations. Stakeholders can focus on operating profit to know how well the company is generating profits from its primary business activities.
  2. Efficiency Benchmarking: Operating profit allows for benchmarking and comparisons within the industry. Investors and analysts can assess a company’s operational efficiency by comparing its operating margins with competitors or industry standards. This benchmarking provides insights into whether the company is performing better or worse compared to its peers.
  3. Identification of Operational Strengths and Weaknesses: By analyzing the components of operating profit, such as operating revenue, COGS, and other operating expenses, stakeholders can identify specific areas where improvements can be made. Read more about it in the next section of this article.

Suppose there are two companies A & B. Both companies have reported Rs.100 crores as operating revenue and Rs.50 crores as operating profit. But they differ in COGS and other operating expenses. COGS (A = Rs.30 crore, B = Rs.20 crore). Other operating expenses (A = Rs.20 crore, B = Rs.30 crore). As Company B has a lower direct cost (COGS) and higher non-direct cost (other operating expenses), in terms of cost efficiency it looks better.

Consistently positive and growing operating profit indicates that the company has a robust and efficient business model. It provides confidence that the company can withstand market fluctuations, economic downturns, and industry challenges.

#4. Components of Operating Profit

Operating profit is determined by three main components that contribute to its calculation. These components include operating revenue, cost of goods sold (COGS), and other operating expenses. Here’s a breakdown of each component:

Operating Profit - Components, formula

Operating Revenue

Operating revenue is also known as operating revenue or sales. It represents the total amount of money generated from the sale of goods or services. It includes all income generated directly from the company’s core operations. Operating revenue can include revenue from the sale of products and services.

The total revenue of a company can be broadly classified into two types, ‘operating revenue’ and ‘other income.’ In the calculation of operating profit, only operating revenue is considered.

Cost of Goods Sold (COGS)

COGS is also an operating expense but it considers only direct costs. Cost of Goods Sold (COGS) refers to the direct costs incurred in the production or delivery of goods or services. COGS typically includes expenses such as raw materials, direct labor costs, manufacturing overhead, or direct service costs.

COGS is subtracted from revenue to calculate gross profit, which represents the profitability of the company’s primary operations before considering operating expenses.

In financial reports published by Indian companies, COGS is not directly mentioned. So, here is how one can calculate COGS using other numbers. To calculate the COGS, one can use the following formula:

COGS Formula

To obtain values of new purchases, we can use the below numbers from the company’s P&L account.

[Note: The companies of the Service sector, like TCS, Infosys, etc maintain no inventory. For such companies, COGS is calculated as zero. Hence, such companies will have gross profit and operating profit equal to each other.]

Other Operating Expenses

Other operating expenses are non-direct costs necessary to run the company’s operations. It encompasses all costs associated with running a company’s day-to-day operations, excluding COGS.

Operating expenses can include items such as marketing and advertising expenses, R&D costs, employee salaries, rent, utilities, administrative expenses, and other overhead costs.

#5. Interpreting Operating Profit

Operating profit is a valuable financial metric that provides insights into a company’s operational efficiency and profitability. However, to gain a comprehensive understanding of a company’s financial health, it is essential to consider it in conjunction with other financial metrics.

Here’s how operating profit can be used in combination with other metrics:

Net Profit

Net profit represents the final profitability measure after deducting all expenses. It includes operating expenses, interest expenses, taxes, and non-operating items.

By comparing operating profit with net profit, stakeholders can assess the impact of non-operating factors on overall profitability.

A significant difference between operating profit and net profit may indicate the presence of non-operating items. Non-operating factors can be one-time gains or losses, interest expenses, or tax implications, etc.

Evaluating the relationship between operating profit and net profit helps understand the comprehensive financial performance of the company.

Gross Profit Margin

Gross profit margin is calculated by dividing gross profit (revenue minus COGS) by revenue. It represents the profitability of a company’s core operations (production) before considering other operating expenses.

By comparing the gross profit margin with the operating profit margin, analysts will know where are the cost concerns. If the gross margin is sufficiently higher than the operating margin, it means that the company is spending more on sales and marketing, R&D, salaries, etc. To bring a party between gross and operating margins, there is a possibility of cost-cutting on the other operating expenses side.

Cash Flow

Analyzing operating profit alongside cash flow metrics provides insights into the company’s cash-generating capabilities.

Cash flow from operating activities reflects the actual cash generated from core operations. Comparing operating profit with cash flow helps assess the quality of profit.

A critical question that will be answered here is that, whether the company’s reported profits are translating into actual cash flow.

If operating profit is significantly higher than cash flow, it may indicate potential cash flow challenges or non-cash accounting items affecting profitability.

Return on Invested Capital (ROIC)

ROIC measures the profitability of an investment relative to the invested capital. It is a ratio between after-tax operating income and the invested capital.

By comparing the operating profit margin to ROIC, analysts can assess the company’s efficiency in generating returns on its investments.

A higher ROIC indicates better capital utilization and long-term sustainability. Operating Profit Margin, on the other hand, reflects the profitability of the company’s core operations by indicating the percentage of revenue that translates into operating profit.

A higher Operating Profit Margin signifies better operational efficiency and cost management.

Debt Levels

Evaluating operating profit in relation to the company’s debt levels helps gauge its ability to service its debt obligations.

Assessing metrics such as the interest coverage ratio-ICR (operating profit divided by interest expense) helps determine the company’s capacity to cover interest payments from its operating earnings.

A higher interest coverage ratio suggests a lower risk of default and a stronger financial position.

A high operating margin and high ICR give a clear indication that the company has no debt-related problems.

Industry Comparisons

Comparing the operating profit margins of a company with industry peers or benchmarks provides context. It helps assess the company’s relative performance.

Understanding how the company’s financial health measures up to industry standards and competitors’ metrics can identify areas of strength or weakness and support informed decision-making.

#6. Limitations of Operating Profit

While operating profit is a valuable measure of a company’s financial performance, it does have limitations when used as a standalone measure.

Here are some key limitations to consider:

  • Ignores Financing and Capital Structure: Operating profit does not consider the impact of a company’s financing decisions or capital structure. It does not account for interest expenses, debt repayments, or the cost of capital. As a result, it does not provide a comprehensive view of the company’s financial obligations and the efficiency of its capital utilization.
  • Lack of Cash Flow Consideration: Operating profit is an accounting measure that focuses on revenue and expenses. It does not directly reflect the company’s cash flow. Cash flow from operating activities, which includes changes in working capital, can differ significantly from operating profit. It can be due to factors such as the timing of payments and receipts.
  • Industry-Specific Factors: Operating profit alone may not be sufficient for comparing companies across different industries. Industries have varying cost structures, business models, and capital requirements, which can affect operating profit margins. Comparisons between companies in different industries solely based on operating profit may lead to inaccurate conclusions.

To overcome these limitations of operating profit, it is important to consider additional financial metrics while analyzing a company. Other metrics can be net profit, cash flow, ROIC, etc as explained earlier.

Conclusion

Operating profit is a critical financial metric that provides insights into a company’s operational efficiency and profitability. Its focus is on the profits generated from core operations. It allows analysts to assess the company’s ability to generate sustainable income from its fundamental business activities.

However, it is important to recognize the limitations of operating profit as a standalone measure of a company’s financial performance.

Operating profit has its drawbacks. It excludes all non-operating items. It kind of neglects the financing and capital structure of the company. Operating profit also does not take note of the cash flow potential of a company. Hence, operating profit may not provide a comprehensive view of a company’s profitability.

To gain a comprehensive understanding of a company’s financial health, it is crucial to consider operating profit in conjunction with other financial metrics.

Ultimately, operating profit serves as an essential component in assessing a company’s financial performance. What is that component? The efficiency of the company to produce goods and services. Generally speaking, companies with good operating profit margins are considered financially healthy. But it is also true that there are exceptions. Excessively debt-burdened companies may not follow this general rule.

Understanding Operating Profit: A Key Metric for Assessing Business Performance

[contact-form][contact-field label=”Name” type=”name” required=”true” /][contact-field label=”Email” type=”email” required=”true” /][contact-field label=”Website” type=”url” /][contact-field label=”Message” type=”textarea” /][/contact-form]

A Comprehensive Analysis of the Indian Healthcare Sector for Long-Term Investment


The Indian healthcare sector is one of the fastest-growing sectors in the country. It has grown with a CAGR of over 20% in the last few years. This growth is being driven by a number of factors which we will discuss in this article.

In the quest for long-term investments with promising growth potential, the Indian healthcare sector stands out as a beacon of opportunity. With a rapidly growing economy and an increasing focus on healthcare and well-being, India has witnessed significant advancements in its healthcare industry.

This blog post aims to delve into the depths of the Indian healthcare sector. It will offer an analysis that will aid one in building a perspective about the total healthcare sector in general. Such knowledge eventually assists in the identification of quality stocks that one can use for long-term holding.

I’ve published a short 8-page report on a small-cap stock that is from the healthcare sector. Though I’ve done this stock analysis for myself, I thought to share it with my readers as well. Check here for the details and how to access the report.

Let’s discuss a few factors that are expected to assist the systematic growth of the Indian healthcare sector. These factors are currently contributing to the growth of the Indian healthcare sector, and this growth is expected to continue in the coming years.


Indian Healthcare Sector Analysis - Image

#1. Demand And Demographics

India’s healthcare sector is poised for substantial growth, primarily due to its burgeoning population and rising disposable income levels. As a developing nation, India is witnessing a demographic shift, with an expanding middle class and an aging population. This shift leads to an increased demand for healthcare services, pharmaceuticals, medical devices, and infrastructure development.

Here are a few demographic-linked factors that are driving growth in the healthcare space.

  • Rising income levels: As incomes rise, more and more Indians are able to afford to pay for healthcare.
  • Increasing awareness of health: Indians are becoming more aware of the importance of good health. They are taking steps to improve their health by eating healthier, exercising more, and getting regular check-ups.
  • Growing population: India has a young and growing population. It means that there is a large pool of potential customers for healthcare services.

#2. Government Initiatives and Reforms

The Indian government has recognized the significance of the healthcare sector and has implemented various reforms to drive its growth. Initiatives like Ayushman Bharat, the world’s largest government-funded healthcare scheme. It aims to provide health coverage to over 500 million people.

The government’s focus on promoting medical tourism and the introduction of tax incentives for the healthcare industry further fuel the sector’s expansion.

#3. Pharmaceutical Industry

India is recognized globally as a major player in the pharmaceutical industry. It is the largest provider of generic drugs worldwide and supplies a significant share of the global demand. The presence of skilled professionals, cost advantages, and a strong regulatory framework has made India an attractive destination for pharmaceutical companies.

Investing in well-established pharmaceutical companies with a robust pipeline of products can yield long-term returns.

#4. Healthcare Infrastructure Development

With increasing investments in healthcare infrastructure, India is witnessing the development of state-of-the-art hospitals, diagnostic centers, and specialized treatment facilities. The government’s emphasis on universal healthcare access and the rise of private healthcare providers are driving the demand for infrastructure development.

Investors can consider companies involved in healthcare real estate, medical equipment manufacturing, and facility management for long-term growth prospects.

Here is an 8-page report on a small-cap stock that is from the healthcare infrastructure industryI did this stock screening and analysis for myself. But I thought to share my findings and conclusions with my readers. Check here for the details and how to access the report.

#5. Technological Advancements and Digital Health

Technological advancements and the adoption of digital health solutions are revolutionizing the Indian healthcare sector. Telemedicine, health apps, and electronic medical records are becoming mainstream, enhancing the accessibility and efficiency of healthcare services.

Investing in companies involved in healthcare technology, telehealth platforms, and health analytics can provide long-term growth opportunities.

#6. Diagnostics and Medical Devices

The demand for diagnostics and medical devices in India is witnessing a significant upswing. The increasing prevalence of chronic diseases, growing awareness regarding early disease detection, and advancements in medical technology are driving this demand.

Investors can explore opportunities in companies manufacturing diagnostic equipment, medical imaging devices, and other cutting-edge medical devices.

#7. Regulatory Landscape and Risks

While the Indian healthcare sector presents lucrative investment opportunities, it is essential to consider the regulatory landscape and associated risks. Investors must thoroughly assess the regulatory environment, potential policy changes, and compliance requirements.

Factors like pricing control mechanisms, intellectual property protection, and quality standards can significantly impact the sector’s growth.

As with any investment, there are risks associated with investing in the Indian healthcare sector. One risk is that the sector is cyclical, meaning that it can be affected by economic downturns. Another risk is that the sector is subject to government regulation, which can change over time.

Despite these risks, the Indian healthcare sector is a good long-term investment opportunity. The sector is growing rapidly, and there is a large pool of potential customers.

The government is also investing heavily in healthcare, which will help to drive growth in the sector.


Investing in the Indian Healthcare Sector

There are a number of ways to invest in the Indian healthcare sector. One way is to invest in individual stocks of healthcare companies. Another way is to invest in mutual funds or exchange-traded funds (ETFs) that focus on the healthcare sector.

  • When investing in individual stocks, it is important to do one’s research and select companies that are well-managed and have a strong track record of growth. One should also consider the company’s financial strength and its ability to compete in the market.
  • When investing in mutual funds or ETFs, one can choose from a variety of funds that focus on different aspects of the healthcare sector. Some funds focus on hospitals, while others focus on pharmaceutical companies or medical device manufacturers.

Conclusion

As India strides towards becoming a global economic powerhouse, the healthcare sector emerges as a compelling investment avenue for long-term investors.

With a growing population, rising disposable incomes, government initiatives, and technological advancements, the Indian healthcare sector is poised for remarkable growth.

Investors who carefully evaluate the sector’s potential and navigate the associated risks can unlock substantial returns over a holding period of 10-15 years. Diversifying their portfolios and considering well-established companies from this space can be a strategy. One can pick companies from the pharmaceuticals, healthcare infrastructure, technology, diagnostics, and medical devices segment. This way the investors can position themselves to capitalize on the transformative journey of the Indian healthcare sector.

A Comprehensive Analysis of the Indian Healthcare Sector for Long-Term Investment

[contact-form][contact-field label=”Name” type=”name” required=”true” /][contact-field label=”Email” type=”email” required=”true” /][contact-field label=”Website” type=”url” /][contact-field label=”Message” type=”textarea” /][/contact-form]

Enterprise Value Unleashed: The Quantum Perspective


From an investor’s perspective, the utility of enterprise value lies in its ability to provide a comprehensive assessment of a company’s total value. By considering both equity and debt components, investors can gain a clearer understanding of the company’s financial structure and potential risks. This metric serves as a valuable tool for evaluating potential acquisitions. It helps investors assess the true cost and value of a target company before making investment commitments.

In the realm of finance and valuation, Enterprise Value (EV) is a stalwart metric that has provided insights into a company’s worth for decades. However, what if we push the boundaries of conventional thinking and explore an innovative, out-of-the-box perspective on EV?

Welcome to the quantum realm of Enterprise Value. Here we unravel the hidden layers of valuation through the lens of quantum physics.

What is quantum physics? It is a branch of science that studies how things work at the very smallest level. It’s different from the physics we learn in school. It deals with things that are too small to see, like atoms and electrons. Quantum physics is important because it helps us understand how the universe works and how things like light and matter behave.

We’ll use our know-how of quantum physics to understand the concept of Enterprise Value (EV).

But before that, let’s understand the basic concept of Enterprise Value in simple financial terms.


The Concept of Enterprise Value

Enterprise value (EV) is a measure of the total value of a company, taking into account its debt and cash. It is calculated as follows:

Enterprise Value - Basic Formula
  • Market capitalization: The market capitalization of a company is calculated by multiplying the number of shares outstanding by the current share price. The number of shares outstanding can be found on the company’s financial statements. The current share price can be found on a stock exchange website.
  • Debt: The debt of a company is the total amount of money that it owes to its creditors. The debt can be found on the company’s balance sheet.
  • Cash: The cash of a company is the amount of money that it has on hand. The cash can be found on the company’s balance sheet under the head ‘current assets.’

Enterprise Value is often used as a measure of a company’s attractiveness to potential buyers. A higher EV indicates that a company is more expensive to acquire. But it also indicates that the company has more assets and/or is generating more cash flow.

The Use of Enterprise Value (EV)

EV can be used in a variety of ways, including:

  • Comparing the value of companies with different levels of debt: The EV can be used to compare the value of companies that have different levels of debt. This is because EV takes debt into account, while market capitalization does not. For example, two companies with the same market capitalization could have very different enterprise values, if one company has a lot of debt and the other company does not.
  • Valuing a company for acquisition or merger: EV can be used to value a company for acquisition or merger. This is because EV takes into account the company’s debt, cash, and future growth potential.

Valuing A Company For Acquisition

Suppose I want to sell my Company A.

For a layman, the cost that one should pay to buy all shares of Company A is equal to its market capitalization. Suppose the market capitalization of my Company A is Rs.30,000 Crore. To take over the company, one should pay me Rs 30,000 crore and take control of A.

But this will be a mistake of the Buyer. I will gain, but the buyer may lose this way. How? Because, further to Rs.30,000 Crore payment, the buyer may still incur more costs related to A’s 100% acquisition.

Suppose at the time of sale, my Company A was carrying a debt of Rs 1,000 Crore. After the takeover of A, these Rs 1,000 Crore will become the buyer’s liability. So, even though he has already paid Rs 30,000 Crore, he will further need to pay Rs 1,000 Crore to the lenders of “A”.

In this case, the cost of the buyer will increase (Rs 30,000+1,000=Rs 31,000 Crore). Had the buyer paid only Rs.29,000 Crore to me, considering “A” has a debt of Rs.1,000 crore, it would have been the true valuation of the company.

Enterprise Value - Debt Consideration To Acquire a Co

The total effective cost to the buyer will be Rs.30,000 (29,000 paid to the present owner + Rs.1,000 paid to lenders). This is important. Upfront, the buyer must pay only Rs.29,000 crore to the present owner of “A”. From where comes this realization that one must also consider debt levels while calculating true value? By looking at the components of the Enterprise Value Formula.

Now, with this formal understanding of the Enterprise Value in place, let’s try to understand it through the lens of Quantum Physics.

Section 1: Quantum Superposition and Valuation

Let’s draw a parallel between the principles of quantum superposition and the diverse components of Enterprise Value.

  • Quantum Superposition: As per it, particles can be in two places at once. It helps us understand how the universe works at the very smallest level. For example, an electron can be in two places at once, or it can be both a wave and a particle simultaneously. This is because quantum particles don’t behave like the objects we’re used to in our everyday lives. They follow different rules, and one of those rules is that they can be in multiple states at once.

Taking reference from our knowledge of a quantum particle, that can exist in multiple states, we try to learn about a company’s valuation. We will explore how different aspects of a company’s value, such as market capitalization, debt, and cash, can coexist in a quantum-like superposition.

We will delve into the interplay between these elements and discuss the implications of valuing complex business entities.

Like quantum mechanics is complicated and counterintuitive, valuing a company is also complex. Hence, as an investor, we must do the analysis with a more open perspective.

Example

Imagine a company called Quantum Enterprises. Just like particles in quantum physics, Quantum Enterprises can exist in multiple states simultaneously when it comes to its valuation. Each state represents a different aspect of the company’s value, such as market capitalization, debt, and cash. This simultaneous existence of various valuation components is what we refer to as quantum superposition in the context of Enterprise Value.

Understanding it using numbers

The company (Quantum Enterprises) has a market capitalization of Rs. 8000 Crore, a debt of Rs. 4000 Crore, and cash reserves of Rs. 1600 Crore. In classical finance, we would typically consider market capitalization alone to determine the company’s value. However, in the quantum perspective of Enterprise Value, we take into account all the components simultaneously.

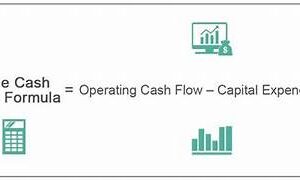
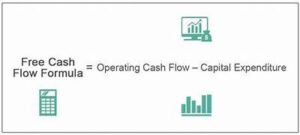
The formula of enterprise value looks like this:

Enterprise Value - Formula

In this case, the valuation of Quantum Enterprises would be in a state of quantum superposition. Here, it is both, a Rs. 8000 Crore company (market cap) and a Rs.10400 Crore company (enterprise value).

Why is this important? Quantum superposition in valuation allows us to consider a more comprehensive picture of a company’s value. By acknowledging the coexistence of different components, we gain insights into the financial health, stability, and growth potential of the company (Quantum Enterprises).

Now, let’s think about the implications of quantum superposition in valuation. Suppose Quantum Enterprises has a high market capitalization, indicating strong investor confidence and a positive perception of the market. However, if we solely rely on market capitalization and ignore the debt and cash components, we may overlook important factors that can significantly impact the company’s true value.

By considering all the components simultaneously, we recognize the influence of debt and cash on the company’s intrinsic value. If Quantum Enterprises has a substantial debt burden, it might indicate a higher risk. Similarly, the cash component can enhance the company’s value, as it provides liquidity and financial flexibility for growth opportunities, acquisitions, or debt reduction.

Inference #1 (Quantum Superposition)

Quantum superposition in valuation broadens our perspective by encompassing all the relevant components simultaneously. It helps us avoid oversimplification and provides a more comprehensive understanding of a company’s true worth.

By recognizing the multiple states of Enterprise Value, we can make better-informed investment decisions. It will give us deeper insights into the financial health and prospects of a company like Quantum Enterprises.

Section 2: Quantum Entanglement and Market Dynamics Influencing Enterprise Value

Quantum entanglement, famously referred to as “spooky action at a distance” by Einstein, offers a fascinating perspective on the interconnectedness of particles. We will explore how this concept can be applied to the dynamic relationship between a company’s Enterprise Value and the broader market.

By considering the entanglement between a company’s valuation and market trends, we can gain deeper insights. There is an intricate dance of supply and demand, investor sentiment, and economic forces that shape the enterprise Value. The correlation between quantum entanglement and market dynamics will give us insights.

  • Quantum Entanglement: In the world of quantum physics, it is a fascinating phenomenon. It refers to the interconnectedness of particles, even when they are physically separated. Similarly, in the context of Enterprise Value and market dynamics, we can explore how companies’ valuations become entangled with the broader market trends and forces.

Analogy

To understand this concept, let’s use an analogy:

Imagine you have two companies, Company A and Company B. Company A operates in the technology sector, while Company B is in the healthcare industry. Now, let’s assume that the overall market sentiment towards the technology sector is positive, leading to an increase in the valuations of technology companies. At the same time, the healthcare sector faces some challenges, resulting in a decrease in the valuations of healthcare companies.

Enterprise Value - market's mood

In this scenario, the valuations of Company A and Company B become entangled with the broader market dynamics. Even though they are separate entities, their values are influenced by the market sentiment toward their respective sectors.

Now, let’s connect this concept to Enterprise Value:

The Enterprise Value of a company, like Company A or Company B, can be entangled with the overall market trends and forces. For instance, suppose, the technology sector experiences a boom and investors have high expectations for technology companies. In this case, the Enterprise Value of Company A might increase as its market cap will rise. On the other hand, if the healthcare sector faces regulatory challenges or unfavorable market conditions, the Enterprise Value of Company B might decrease.

This entanglement between a company’s valuation and market dynamics is crucial to understand as it provides insights into the complex relationship between a company and its market environment.

Inference #2 (Quantum Entanglement)

Understanding the entanglement between Enterprise Value and market dynamics helps investors and analysts make more informed decisions. A company’s value is not solely determined by its internal factors but also intertwined with the broader market sentiment. If investors can realize it, a better assessment of the potential risks and opportunities associated with investing in a particular company can be made.

In summary, quantum entanglement in market dynamics emphasizes the interconnected nature of a company’s valuation with broader market trends and forces. By considering this entanglement, investors can gain a deeper understanding of how market dynamics influence the Enterprise Value of a company. It reminds us that a company’s worth is not isolated but entangled within the intricate dance of supply and demand, investor sentiment, and economic factors that shape the overall market dynamics.

Section 3: Quantum Tunneling and Risk Assessment

In the context of Enterprise Value and risk assessment, we can draw a parallel. This way we’ll understand how companies with high Enterprise Value can exhibit resilience and navigate through challenging economic conditions.

Analogy

To understand this concept, let’s use an analogy.

Imagine you have two companies, Company X and Company Y, operating in the same industry. Both companies face an economic downturn that negatively impacts their revenues and profitability. However, Company X has a significantly higher Enterprise Value compared to Company Y.

Now, let’s explore how quantum tunneling relates to these companies:

Quantum tunneling suggests that, despite facing barriers or challenges, certain particles can pass through them. Similarly, in the world of business and finance, a company with a high Enterprise Value, like Company X, may possess the ability to “tunnel” through obstacles and navigate the downturn more effectively compared to a company with a lower Enterprise Value, like Company Y.

Here’s why this is important for risk assessment:

A company with a high Enterprise Value often indicates that it has built a strong foundation, such as a solid customer base, strong brand recognition, or strategic assets. These factors provide a level of resilience that allows the company to weather economic storms more effectively. In other words, just as particles can tunnel through barriers, companies with high Enterprise Value can overcome challenges and maintain their value even in adverse circumstances.

Inference #3 (Quantum Tunneling)

Quantum tunneling in risk assessment suggests that companies with high Enterprise Value can exhibit resilience and navigate through challenging economic conditions more effectively. By considering the tunneling potential of a company, investors and analysts can gain insights into its capacity to withstand volatility and maintain its value, even in adverse circumstances.

Quantum tunneling also reminds us that a company’s Enterprise Value is not solely determined by external economic conditions but also by its internal strength and ability to overcome barriers and challenges.

Conclusion

EV is a valuable metric that can be used to compare the value of companies and the value of a company for acquisition or merger. However, it is important to be aware of the limitations of Enterprise Value (EV) and to use it in conjunction with other metrics when making investment decisions.

How the knowledge of the enterprise value is useful for an investor? To buy a company, an investor would like to pay only the share price to acquire the shares of the company. But if a company also has cash in its balance sheet, the investor would happily pay for it as well.

So, the cost of acquisition increases because of the cash component.

Cost of Acquisition = Market Cap + Cash

If the company also has debt in the company’s balance sheet, the investor would seek a discount from the seller on account of the debt.

Now, the cost of acquisition will decrease because of debt.

Cost of Acquisition = [Market Cap + Cash] – Debt

As market capitalization, debt, and cash are the components of the Enterprise Value, a purposeful study of these components will highlight the fair cost of the acquisition of a company.

I hope you’ve enjoyed reading this out-of-the-box explanation of the enterprise value.

Enterprise Value Unleashed: The Quantum Perspective

[contact-form][contact-field label=”Name” type=”name” required=”true” /][contact-field label=”Email” type=”email” required=”true” /][contact-field label=”Website” type=”url” /][contact-field label=”Message” type=”textarea” /][/contact-form]