Fundamental Analysis of UPL Limited

The UPL Limited has been in my stock portfolio for some time. At the current valuations, the company is valued at Rs.45,000 crores as its market capitalization. In the last 10 years, this stock has yielded a price appreciation of about 20% per annum. Now, I’m trying to reevaluate my holdings in this company.

UPL Limited - 10Y Price Data

The last 10-year price data of UPL Limited shows a decent picture. But in the last 5 years, the stock has remained mostly flat. The CAGR (growth) of the stock price has been a dismal 6.6%. For an equity investor, this is not acceptable. Five years of holding time is a decent long-term, and a below-average return of 6.6% is bad. Even Nifty 50 has given an 11% CAGR return in the last 5 years.

UPL Limited - 5Y Price Data

So, for long-term investors like me, it is time to reevaluate our holdings in this stock. In normal circumstances, I would have sold this stock feeling happy that the stock did its job in my last 10 years of holding (20% CAGR).

But in the last sixteen months or so, there has been a tremendous correction in this stock. The stock price has fallen from Rs.820 to Rs. 600 levels (-28%). In the last 1 year, the price has gone down by more than 20%.

UPL Limited - price correction in last 16 months
UPL Limited - 1Y Price Data

So, I’m evaluating whether should I consider selling my holding or buy more of it. Whenever I face this kind of dilemma, it is an indicator that I should do a thorough fundamental analysis of my stock.

When I say fundamental analysis, doing the analysis of a stock using the DCF Method is what I mean.

I would just like to bring it to your attention that my Stock Engine has given UPL Ltd an Overall Score of 46.4% which is too low.

Spider Diagram for UPL - Stock Engine2

#1. Intrinsic Value Estimation

I estimate the intrinsic value of my stocks mostly using the DCF Method for which we need free cash flows.

There are two ways to calculate the free cash flows of the company. The first and the primary one is taking numbers from the cash flow report. The second method is where the numbers are collected from the profit and loss accounts of the company. Learn to read financial statements of companies.

For such stocks that have remained flat for extended periods (like 5 years), I’ll rely only on the numbers from the cash flow report. It is a stringent method but for flattish stocks like UPL Limited, it is what is necessary.

The idea is to check, what has caused the stock to remain flattish for the last five years. The analysis will also unearth if I should add more to my holdings in this stock or rather sell it.

The analysis should start with free cash flow calculations.

#1.1 Free Cash Flow To Firm (FCFF)

To calculate free cash flow to the firm (FCFF), we’ve two alternatives. But for UPL we’ll rely only on the values from its cash flow report. Why? Because I want my conclusion to be close to reality. I’ve more confidence on the numbers of the cash flow report.

We need the following values to estimate its FCFF:

  • Net Cash Flow From Operating Activities.
  • Capex.
Description 2023 2022
PAT 4,414 4,437
Net cash flow from operating activities 7,751 6496
CAPEX -1,672 -2,022
FCFF 6,079 4,474

The free cash flow to the firm comes out to Rs. 6079 and Rs. 4474 crores in the last two years. During these two FYs, the company has reported a net profit of Rs.4,414 and 4,437 crores respectively.

Net cash flow from operating activities is actually higher than the PAT. It is a big positive.

But before we can finally conclude if the free cash flow is healthy for its investors or not, we must calculate the free cash flow to equity (FCFE).

Please Note: We can also use another formula to calculate the FCFF. This formula is FCFF = PAT + D&A – Capex – Increase in Working Capital. Using this formula as well, the FCFF of UPL Limited comes out to be Rs.4,042 Crore in the FY 2022-23. To know how to calculate FCF, check this article.

#1.2 Free Cash Flow To Equity (FCFE)

FCFF and FCFE are both measures of a company’s free cash flow. However, there are some key differences between the two.

  • FCFF: FCFF is the cash flow available to all types of investors. Here, both shareholders and debt providers to the company are referred to as investors.
  • FCFE: FCFE is the cash flow available only to shareholders.

When we are doing DCF analysis, we are mainly doing it as an existing or prospective shareholder of the company. Hence, for us, FCFE is the required metric. To know more about FCFF and FCFF, read this article on free cash flow.

To calculate FCFE, we’ll need the following numbers:

  • Free Cash Flow To Firm (FCFF).
  • Net New Debt (= Net Debt taken – Debt Repaid).
  • Interest Paid (Finance Cost).
  • Effective Tax Rate.
Description 2023 2022
FCFF 6,079 4,474
Net New Debt -4,595 1,306
Interest 2,345 1,941
Tax Rate 14.74% 10.65%
FCFE -515 4,046

You can see that, in FY 2022-23, the Free Cash Flow (FCFE) for the company comes out as negative.

The main reason why the FCFE is negative is that the company has used the majority of its FCFF to pay back the loan’s principal and interest.

In a way, it is good that the company is using its cash flows to get rid of its loan burden. But the immediate effect of these loan paybacks is causing its FCFE (free cash flow) to go into negative.

To understand why the debt is draining so much of the company’s cash flows, we must also look at its capital structure.

#1.3 Debt Analysis is Necessary

Negative free cash flow to equity is like negative net profit. To the owners (shareholders) of the company, Free Cash Flow To Equity (FCFE) is the real profit. A positive PAT or FCFF is not as relevant.

So, for UPL Limited, we’ve seen that though the company has posted good PAT and FCFF numbers, its FCFE is still negative in FY 2022-23. The reason for this negative reporting was debt repayment, both principal and interest.

To understand why so much cash is flowing out to manage debt, let’s look at the company’s capital structure and its debt-to-equity ratio.

Description Mar-23 Mar-22 Mar-21 Mar-20 Mar-19
Net Worth 26,858.00 21,675.00 17,901.00 16,296.00 14,715.00
ST Borrowings 2,855.00 4,261.00 1,414.00 1,298.00 2,478.00
LT Borrowings 20,144.00 21,605.00 22,146.00 27,371.00 26,383.00
Total Debt 22,999.00 25,866.00 23,560.00 28,669.00 28,861.00
Total Capital 49,857.00 47,541.00 41,461.00 44,965.00 43,576.00
Debt To Equity 0.86 1.19 1.32 1.76 1.96
Debt as % of Total Capital 46.13% 54.41% 56.82% 63.76% 66.23%

Out of the total capital of the company, nearly 50% is financed from debt. In the FY ending March ’19, the debt dependency was as high as 66.23%. The debt-to-equity ratio in the same year was 1.96, which is too high.

Though the company has tried to reduce its debt dependency in the last 5 years, its debt levels are still too high.

The result of this high debt is that the company is yielding negative free cash flow to equity (FCFE) which is detrimental to the shareholders.

Conclusion

If we look only at the company’s last 10 years reported numbers, the performance of UPL Limited is very good. From these numbers, it looks like that company is poised to grow at the rate of about 15% per annum.

Description FY 2023 FY 2014 Growth
Revenue (Rs.Cr.) 54,053 10,902 17.36%
EBITDA (Rs.Cr.) 10,503 2,057 17.71%
PAT (Rs.Cr.) 4,257 942.10 16.28%
Reserves (Rs.Cr.) 26,708 5,162 17.87%
Total Assets (Rs.Cr.) 88,577 12,858 21.29%
Net Cash From Operations (Rs.Cr.) 7,751 1,442.11 18.31%
Projected Future Growth 15% p.a.

Some people might get carried away with these numbers and invest in UPL.

But when we drill into its free cash flows, we will see that there is no cash available for the shareholders (FCFE). The reason for this lack of cash is that most of its cash is being used to pay back the loan.

When the FCFE of a company is negative, its intrinsic value becomes zero. Hence, at all price levels, it will look expensive.

Final View

But does the negative FCFE make UPL non-investible? Absolutely not. Why? Because seeing the other fundamentals of the company, negative FCFE looks like a temporary phenomenon. The kind of market share the company has, cannot be ignored. Such stocks must be bought at a higher margin of safety.

Suppose, in the next two years, the company manages to convert its FCFE into positive. Currently, its FCFF is about Rs.6,000 Crore. Let’s say, it is able to convert about 10% of its FCFF into FCFE (Rs.600 Crore). Assuming a slow normal period growth rate of 12% and nominal growth rate of 3%, at a 12% discount rate, the intrinsic value of UPL comes out to be Rs.560 per share.

At the current price level of Rs.600, it is trading at a PE multiple of 16.5. If the stock’s price corrects by another 10% to 15% from these levels, I may consider reinvesting in it.

For the moment, I’m neither selling nor buying. I’ll say, between Rs.500 and Rs.575, for me, this stock is a decent long-term buy (holding period 10 years).

Have a happy investing.

Suggested Reading:

Fundamental Analysis of UPL Limited

[contact-form][contact-field label=”Name” type=”name” required=”true” /][contact-field label=”Email” type=”email” required=”true” /][contact-field label=”Website” type=”url” /][contact-field label=”Message” type=”textarea” /][/contact-form]

Mastering High Returns of Capital: Insights from Warren Buffett and Charlie Munger


We’ll delve into the investment minds of Warren Buffett and Charlie Munger as we explore their profound perspectives on the high returns of capital. We’ll try to gain insights by looking into their perspective on capital deployment by companies. As an investor, we know that a company that can yield high returns of capital will be preferred over others.

In stock investing, the pursuit of a high return on capital (ROC) should be the target for every savvy investor. The notion of efficiently deploying capital to yield substantial gains has long been a cornerstone of successful wealth-building strategies. Let’s delve into the profound wisdom of two legendary investment maestros: Warren Buffett and Charlie Munger. Their distinguished approaches to capital deployment offer invaluable insights that transcend the realms of finance.

Warren Buffett and Charlie Munger have a profound ability to identify promising investments and nurture them into financial powerhouses. The core of their philosophy is the concept of high returns on capital. Here there is an interplay between capital infusion and future returns (growth of capital). This is the essence of compounding.

As we navigate the terrain of these investment virtuosos, we uncover the dual facets of their strategies. Buffett’s aspiration for businesses capable of compounding capital at remarkable rates is juxtaposed with Munger’s inclination towards enterprises requiring minimal capital yet yielding exceptional returns. These two perspectives intertwine, illustrating the nuanced approaches that underpin their successes.

Through a lens tinted with pragmatism, we will dissect the practicality of realizing the ideal business – a phenomenon characterized by sustained high returns and a voracious appetite for capital reinvestment. While such entities may appear rare, the investment philosophies of Buffett and Munger prove adaptable to the intricate tapestry of real-world scenarios.

Join us as we unravel the strategies employed by these luminaries, unlocking the door to achieving ‘High Returns of Capital’ in a realm of financial opportunity.

Understanding Capital Deployment Strategies

In the intricate realm of investment, the art of capital deployment stands as a pivotal determinant of financial success. Effectively channeling resources into ventures that yield substantial returns is a hallmark of astute investors. Warren Buffett and Charlie Munger, have each crafted unique strategies when it comes to capital deployment, adding depth and dimension to the pursuit of ‘High Returns of Capital’.

Capital deployment is not merely a matter of investing resources; it is a strategy that can either amplify or constrain potential gains. The ability to allocate funds judiciously is key to generating returns that outpace the initial investment. This concept underscores the significance of capital deployment strategies – a facet that both Buffett and Munger have embraced with distinct perspectives.

Warren Buffett, renowned as one of the most successful investors of our time, places a premium on businesses with the potential to compound capital at extraordinary rates. This approach hinges on the power of compounding – the ability of an investment to generate earnings that are subsequently reinvested, resulting in exponential growth over time.

Businesses with this capability become compounding machines, transforming capital injections into a self-perpetuating cycle of wealth creation.

In contrast, Charlie Munger emphasizes a different aspect of capital deployment. Munger is drawn to businesses that demand minimal additional capital while delivering outsized returns.

This philosophy is rooted in the principle of efficiency – by requiring less capital for growth, a business can achieve substantial returns without the need for extensive reinvestment.

These divergent yet complementary strategies illuminate the multifaceted nature of capital deployment. While Buffett’s approach harnesses the power of sustained compounding, Munger’s perspective capitalizes on resource-efficient enterprises.

The Ideal Business: A Compounding Machine

Within the realm of investment philosophy, few concepts hold as much allure as the notion of the ideal business” – a formidable entity capable of generating high returns on capital while seamlessly reinvesting significant resources at those same compelling rates.

This visionary approach championed by Warren Buffett transcends mere investment strategies, encapsulating the essence of compounding wealth through capital deployment.

Buffett’s concept of the ideal business mirrors a perpetual motion engine, harnessing the twin forces of impressive returns and judicious capital reinvestment.

In this financial alchemy, every dollar invested becomes a catalyst for future growth, setting in motion a self-sustaining cycle of compounded returns. Such a business transforms capital into a dynamic force that propels it forward, consistently outperforming conventional investment models.

Consider the quintessential example of Berkshire Hathaway itself – an ideal business. Over the decades, Buffett nurtured Berkshire Hathaway into a compounding machine, a financial juggernaut that continually reinvests capital into diverse ventures, generating remarkable returns. Each subsidiary, operating with operational autonomy and contributing to the parent company’s bottom line, exemplifies the principle of capital compounding in action.

The idea of the ideal business goes beyond profit. It embodies a strategic vision where capital’s ability to generate returns becomes a driving force for success. By understanding and applying Buffett’s principles of capital deployment, investors can uncover opportunities that embody the essence of a compounding machine.

Reality Check: Rare Nature of High-Return Capital Businesses

While the concept of businesses capable of deploying increasing capital at consistently high rates of return evokes intrigue and aspiration, a reality check reveals their rarity within the investment landscape. Warren Buffett’s pursuit of the ideal business, a compounding machine capable of exponential growth through capital deployment, is indeed a formidable vision. Yet, the real world often demonstrates that such entities are few and far between.

Enterprises like Coca-Cola and See’s Candy stand as testaments to the distinct dichotomy between impressive returns and incremental capital deployment. These big brands, while undoubtedly possessing the capacity to generate handsome profitsdeviate from the paradigm of unceasing capital compounding. Their hallmark lies in the art of generating substantial returns without necessitating substantial injections of additional capital.

Coca-Cola, an emblem of global consumerism, thrives on its brand strength and distribution network, attributes that enable it to churn out considerable profits with very low capital requirements. Similarly, See’s Candy, renowned for its delectable confections, exemplifies the power of consistent returns achieved without perpetual capital reinvestment.

While these companies have certainly achieved remarkable financial success, the “relentless compounding of capital” is not a defining characteristic of their business models.

This reality underscores the rarity of businesses that fit the mold of the ideal compounding machine described by Warren Buffett.

While the pursuit of such entities remains a cornerstone of investment aspiration, it is imperative to acknowledge the paucity of these opportunities in practice.

The Berkshire Hathaway’s Structure

In the orchestration of capital deployment strategies, the structure of an investment conglomerate assumes a pivotal role in amplifying returns and optimizing resources. Warren Buffett’s Berkshire Hathaway stands as an exemplar of this strategic ingenuity. It is an example of the art of reallocating capital across diverse businesses.

At the heart of Berkshire Hathaway’s design lies a flexibility that allows for agile capital reallocation. This distinctive structure enables the conglomerate to harness the advantages of moving cash fluidly across its array of subsidiaries and ventures. This capability often likened to a financial chessboard, grants Buffett and his team the power to strategically position resources where they are best poised to generate substantial returns.

The art of reallocating capital within Berkshire Hathaway is a symphony of precision. Cash generated by one subsidiary’s success can be seamlessly channeled into another. This way they are maximizing the potential for growth and compounding returns. This dynamic movement allows the conglomerate to transcend the limitations that often constrain businesses with “restricted capital deployment opportunities.”

The advantages of this structure are manifold. It affords Berkshire Hathaway the ability to capitalize on opportunities that emerge across a diverse spectrum of industries, mitigating risk and capitalizing on emerging trends. The conglomerate’s unparalleled flexibility in reallocating capital underscores the essence of a compounding machine, an attribute that echoes Buffett’s visionary concept of an ideal business.

Factors Influencing Capital Deployment

Industry characteristics emerge as a fundamental determinant in the effectiveness of capital deployment. Industries with rapidly evolving landscapes, such as technology, demand nimble resource allocation to capitalize on opportunity.

Conversely, more stable sectors may warrant longer-term capital strategies for sustained growth. The dynamics of each industry shape the tempo at which capital is infused and returns are realized.

Growth opportunities act as catalysts for capital deployment. Businesses poised for expansion necessitate significant resource allocation to seize untapped potential. These opportunities may manifest as market expansions, technological innovation, or strategic acquisitions. The ability to accurately assess growth prospects and allocate resources accordingly is pivotal in achieving high returns on capital.

A company’s internal financial health and management efficacy also play a pivotal role. Prudent capital deployment hinges on adept management, capable of identifying avenues for strategic resource allocation. A company’s track record of capital utilization and its ability to generate returns are indicators of its potential to amplify capital effectiveness.

Furthermore, external economic conditions and market volatility influence the viability of capital deployment strategies. Economic shifts may necessitate agility in reallocating resources to mitigate risks and capitalize on emerging trends. Adaptability to these external forces is a hallmark of successful capital deployment.

There are two types of great businesses we’ll see in the market. A few are ones that are bearing surplus cashand those exhibiting good returns yet constrained reinvestment opportunities.

As an investor, we must learn to deal with these types of companies differently. These distinct businesses demand distinct strategies, each harboring its own set of challenges and advantages.

  • Enterprises with surplus cash stand as a testament to financial prowess. They generate robust profits that exceed operating expenses, resulting in surplus funds. It leads to cash abundance. This cash grants flexibility, allowing businesses to explore expansion, diversification, or strategic acquisitions. Such companies can seize opportunities swiftly. They can use the available resources for strategic growth. However, the surplus cash must be efficiently managed. The decision-making of the top management on how to deploy this cash must yield substantial returns. The challenge lies in identifying ventures that align with the business’s core competencies and amplify shareholder value.
  • Businesses that report high returns but possess limited reinvestment avenues tread a more complex path. These enterprises excel in generating profits, yet their capital requirements for growth may be modest. Such businesses may lack the potential to magnify returns through substantial capital infusion. The advantage here lies in stability; they can channel profits into dividends. This way they can reward shareholders while sustaining the core business. However, the challenge surfaces when they want to see fast growth. As they have limited opportunities for reinvestment, it can lead to stagnation.

A judicious blend of surplus cash utilization and focused reinvestment is the compass. By adeptly navigating the duality presented by these contrasting business types, investors can harmonize returns, growth, and stability, inching closer to the elusive realm of ‘High Returns of Capital’.

Investment Philosophies and the Real World

In the realm of investment, the ideals of capital compounding may appear ethereal, reserved for the rarefied few who discover businesses capable of perpetual reinvestment at high rates of return.

However, the seasoned wisdom of Warren Buffett and Charlie Munger reveals a pragmatic reality: while true compounding machines are a rarity, there’s immense value in businesses that consistently generate good returns on capital.

Buffett and Munger, despite their reverence for the elusive ‘ideal business’, pragmatically navigate the investment landscape by embracing opportunities that exhibit commendable returns. Their investment philosophies pivot on recognizing the power of sustained profitability. They also acknowledge that there are very less businesses around that can deploy vast capital at high rates of return.

In practice, these investment maestros identify businesses that display the potential for steady returns and judicious capital utilization. Such enterprises may not be a compounding machine, yet they display the characteristics of sustainability and consistency of earnings.

Such companies should become integral components of our stock portfolios. They will act as pillars of stability in an unpredictable financial terrain.

Conclusion

In stock investing, the pursuit of High Returns of Capital finds its anchor in the strategic artistry of Warren Buffett and Charlie Munger. While the ideal compounding machine remains a rarity, their wisdom illuminates a multifaceted approach.

Embracing businesses that deliver steady returns and leveraging flexible capital deployment within Berkshire Hathaway’s canvas, they forge a path where realism harmonizes with aspiration.

As investors navigate the landscape, the resounding lesson is clear: while compounding may be elusive, judicious capital utilization” and “sustained profitability” remain within reach. These two objectives in stock investing are a timeless strategy for financial success.

Mastering High Returns of Capital: Insights from Warren Buffett and Charlie Munger

[contact-form][contact-field label=”Name” type=”name” required=”true” /][contact-field label=”Email” type=”email” required=”true” /][contact-field label=”Website” type=”url” /][contact-field label=”Message” type=”textarea” /][/contact-form]

Implied Equity Risk Premium (BSE 500 Index): Is The Market Overvalued?


Implied Equity Risk Premium (BSE 500 Index): Is The Market Overvalued?

Determining whether a market is overvalued or undervalued based solely on the implied equity risk premium (ERP) can be challenging, as it requires a comprehensive analysis of various factors. The implied equity risk premium is one of the tools used by investors and analysts to assess market valuation, but it should be considered alongside other metrics and factors. Here’s how you can analyze it:

  1. What Is Implied Equity Risk Premium (ERP)?: The implied ERP is the difference between the expected return on equities and the risk-free rate of return, as implied by the current stock prices. It is essentially a measure of the extra return that investors require for holding risky assets like stocks instead of risk-free assets like government bonds.
  2. Comparing ERP to Historical Averages: One way to assess market valuation is to compare the current implied ERP to historical averages. If the implied ERP is significantly higher than the historical average, it might suggest that stocks are relatively attractive and that the market could be undervalued. Conversely, if it’s much lower, it might indicate that stocks are overvalued.
  3. Interest Rates: Changes in interest rates can significantly impact the implied ERP. When interest rates rise, the ERP tends to increase as investors may demand a higher return from equities to compensate for the increased risk. Conversely, falling interest rates can lead to a lower ERP. Therefore, it’s crucial to consider the prevailing interest rate environment.
  4. Economic and Market Conditions: Assess the broader economic and market conditions. Factors such as GDP growth, corporate earnings, inflation expectations, and geopolitical events can influence market valuations. A strong economy and rising earnings might justify a lower ERP, while economic uncertainty could push it higher.
  5. Valuation Metrics: Consider other valuation metrics like the Price-to-Earnings (P/E) ratio, Price-to-Sales (P/S) ratio, and Price-to-Book (P/B) ratio for the BSE 500 Index. These metrics provide additional insights into whether stocks are overvalued or undervalued.
  6. Sector Analysis: Evaluate the valuation of different sectors within the BSE 500 Index. Some sectors may be overvalued while others are undervalued, leading to variations in the overall market valuation.
  7. Global Comparisons: Compare the implied ERP of the BSE 500 Index to those of other global stock markets. This can provide context and help determine whether the Indian market is relatively overvalued or undervalued on a global scale.
  8. Qualitative Factors: Consider qualitative factors like investor sentiment, market psychology, and geopolitical risks, which can also influence market valuations.

Ultimately, it’s important to use the implied ERP as one piece of a larger puzzle when assessing whether the market is overvalued or undervalued. Market valuation is a complex and dynamic process influenced by multiple factors, and no single metric or indicator can provide a definitive answer. Investors should conduct a comprehensive analysis that takes into account both quantitative and qualitative factors to make informed investment decisions. Consulting with financial professionals or analysts who have expertise in the Indian market can also be valuable.


In this article, I’ll try to use the method proposed by Mr. Aswath Damodaran to calculate the Equity Risk Premium of an Index. I’ll use the S&P BSE 500 index for our calculations. We can apply the same method of calculation to the equity risk premium (ERP) of individual stocks.

But before proceeding further, allow me to tell you a bit about the concept of equity risk premium.

The risk-free rate (Rf) in India is 7.2% per annum as of today. It is the yield of a 10-year GOI bond. Now, how much average return we expect from our stock market? Suppose a person who invests in a Nifty-50 index ETF or Sensex ETF will expect a minimum return of 12% per annum in the long term. This is our market return (Rm).

The difference between our expected market return and the current risk-free rate becomes the risk premium.

Formula (ERP) = Expected Market Return (Rm) – RiskFree Rate (Rf)

In the example we have considered above, the expected market return was 12% and the current risk-free rate was 7.2%. Hence, the equity risk premium in this case is 4.8% (= 12% – 7.2%). Generally speaking, Indian investors expect about 4.5%-5.5% risk premium when they invest in equity.

Implied Equity Risk Premium

In the above example, we have generally assumed that the Nifty-50 index or Sensex will yield a 12% return. But consider this, as of September 2024, the Nifty (19,500) and Sensex (65,800) are at close to their all-time highs. Buying the index at these levels, may not yield a 12% return in the next 5-6 years.

The point is, that the price that we pay to buy an asset (equity) is important. Buying an undervalued stock will yield higher returns. But if the same stock is bought at overvalued price levels, it will yield lower or sometimes even negative returns.

Hence, the question that we investors always ask before investing in equity is, Is this the right price to buy the stock, index, or an equity mutual fund?

How to answer this question? We generally do this by the use of financial ratios or by estimating the intrinsic value of stocks. Both are the methods to value stocks.

Similarly, implied equity risk premium is a valuation method using which we can tell if a stock, index, or equity fund is worth investing or not.

Let’s use the method of Mr. Aswath Damodaran to estimate the Implied Equity Risk Premium (IERP) of the S&P BSE 500 Index.

Implied Equity Risk Premium of S&P BSE 500 Index

Implied Equity Risk Premium - S&P BSE 500 Index Full Calculation


As of today, the S&P BSE 500 Index is trading at

levels. We are trying to justify whether the market is overvalued or undervalued at these levels of the index.

How we’ll do it? Let’s check the steps:

Step #1: Current Earnings of the Index

We’ll first try to estimate the current earnings of the index. It can be done by estimating the cumulative earnings (net profits) of all the constituent companies of the BSE 500 index. It can be easily estimated. Just go to the web page of the S&P BSE 500 index. On the page, you will see the price earning ratio (P/E) of the index (currently it is 23.88).

Take the inverse of the P/E ratio, it is called earnings yield. It represents the net profits generated by all constituent companies of the index per unit price paid for the index.

  • P/E Ratio: 23.88
  • Earning Yield: 4.19% (=1/23.88*100)
  • Current Level of S&P 500: 27,353.85
  • Cumulative Earnings (Cash Flow): 1,145.47 (=4.19% * 27,353.85)

The value of Rs.1145.47 represents the earnings the S&P BSE 500 index is currently generating.

Step #2: Estimate Future Earnings

Here, we’ll have to assume a suitable earnings growth rate that we can apply on average to all BSE 500 companies. As we are doing it for 500-odd companies, we must be careful with the assumed number. We cannot be overoptimistic as all companies will not grow at an even pace.

We shall also not be too pessimistic because, otherwise it will break our valuation calculations.

As we are dealing with a large number of companies altogether, it will carry some great, average, and low-quality companies. In India, our average inflation is around 6%. These being a group of BSE’s top 500 companies, I’ll assume a safe growth rate of 6.5% per annum for the next 5 years [ProfitG (5Y)].

Beyond the fifth year, I’ll assume a perpetual growth rate of (Gpp) of 3.5% per annum.

Once we have these numbers in place, we are now ready to estimate the future earnings of the BSE 500 Index.

The future set of earnings for the next 5 years and beyond (terminal value) will look like this:

Implied Equity Risk Premium - Future Earnings
  • Current Earning: 1145.47
  • Next 5 Years Earning Growth Rate (ProfitG): 6.5% p.a.
  • Perpetual Growth Rate (Gpp): 3.5% p.a.
    • 2024_Earning: 1219.93
    • 2025_Earning: 1299.22
    • 2026_Earning: 1383.67
    • 2027_Earning: 1473.61
    • 2028_Earning: 1569.39
    • 2028_Earning (TV): 1569*(1.035)/(D-0.035)

Step #3: Calculate Expected Return (D)

All future cash flows that we’ve calculated in step #2 must be discounted, at a suitable rate (D), to their present values. The sum of the present values of all future cash flows must be equal to the present value of the S&P BSE 500 Index (27,353.87 Points).

It is represented by this formula:

Implied Equity Risk Premium - Present Value Formula

Solving for “D”, the above equation will give the answer 8.44%.

Inference: Investing at current levels (27,353.87) in the S&P BSE 500 Index can give a long-term return of 8.44%.

Step #4: Implied Equity Risk Premium

The formula for equity risk premium is this:

Formula (ERP) = Expected Market Return (Rm) – RiskFree Rate (Rf)

  • Expected Market Return (Rm) = 8.44%
  • RiskFree Rate (Rf) = 6.5%
  • Equity Risk Premium ERP: 1.94%
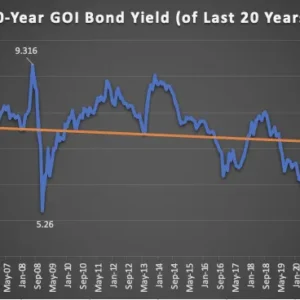
  • Note: As of Sep-2023, the yield of the 10-Y government bond rate is 7.2%. In the last 20 years, the yield of the government bond has changed a lot. The average yield in this period was 7.37%. But looking forward, I am assuming that inflation in India will be cooler. Hence, a 6.5% bond yield will be more relevant.
Equity Risk Premium - 10Y Government Bond Yield

Conclusion

At the beginning of this article we have roughly estimated that, in India, people expect to earn a risk premium of around 4.5% to 5.5% per annum on their equity investments. It means that, if the current risk-free rate is 6.5%, investors would be satisfied if they earn a minimum return between 11% to 12% from equity.

We have also calculated that at the current levels of the BSE 500 Index (27,353.85 levels), the equity risk premium possible will be only 1.94% higher than the risk-free rate. It is a clear indicator that the S&P BSE 500 is overvalued at these levels.

These are the calculated implied equity risk premium of other indices:

Index Date Current
Value
Market
Returns (D)
RiskFree
Rate (Rf)
Equity Risk
Premium (ERP)
S&P BSE SENSEX 06-Sep-23 65,880.52 8.50% 6.50% 2.00%
S&P BSE SENSEX 50 06-Sep-23 20,559.33 8.70% 6.50% 2.20%
S&P BSE LargeCap 06-Sep-23 7,454.00 8.55% 6.50% 2.05%
S&P BSE MidCap 06-Sep-23 32,122.06 8.10% 6.50% 1.60%
S&P BSE SmallCap 06-Sep-23 37,948.61 7.35% 6.50% 0.85%
S&P BSE 500 06-Sep-23 27,401.79 8.38% 6.50% 1.88%
S&P BSE AllCap 06-Sep-23 7,961.72 8.30% 6.50% 1.80%

At the current levels, all indices look overvalued. So, it is better to avoid investing in the market for now.

The equity risk premium of the SmallCap Index is the lowest. Out of all other stocks, it is the smallcap stocks that will be most overvalued for now. So, for value investors, small-cap is currently a no-go space.

A Key Takeaway

The most important aspect of the Equity Risk Premium (ERP) is that it represents the potential reward for taking on the inherent risks associated with investing in stocks. In other words, it quantifies the additional return investors can expect to receive from the stock market compared to risk-free investments (like a bank FD).

This concept is crucial because it underpins many investment decisions. Investors need to understand that the level of risk they are comfortable with should align with their expected returns.

  • A higher ERP suggests the potential for greater rewards but also higher volatility and uncertainty.
  • A lower ERP implies a more conservative, lower-risk investment with commensurately lower expected returns.

In essence, the ERP serves as a fundamental metric that helps us to strike a balance between risk and reward. It guides us in making informed decisions about asset allocation, stock selection, and long-term financial planning.

By comprehending the significance of ERP, we will be better equipped to navigate the complexities of the financial markets and develop strategies that align with our investment goals and risk tolerance.

Have a happy investing.

Suggested Reading:

Stock analysis is complicated, use our Stock Engine to analyze selected 1,300+ number stocks.

The Stock Engine will give its first impression about its stocks. Then it goes deeper and calculate its intrinsic value and the overall score. The Stock Engine makes it easier to interpret the fundamentals of stocks even for untrained investors.

Implied Equity Risk Premium (BSE 500 Index): Is The Market Overvalued?

[contact-form][contact-field label=”Name” type=”name” required=”true” /][contact-field label=”Email” type=”email” required=”true” /][contact-field label=”Website” type=”url” /][contact-field label=”Message” type=”textarea” /][/contact-form]


Think and Grow Rich By Napoleon Hill [Book Summary]


Think and Grow Rich by Napoleon Hill is not just a book; for me, it is a thorough guide of endless possibilities. Published in 1937, it defied the despair of the Great Depression with a revolutionary idea: the power of the human mind to transform dreams into reality. In this compact introduction, we’ll embark on a journey into the heart of this timeless classic.

Hill’s premise is simple yet profound: Your thoughts are the seeds of your destiny. He argues that cultivating a positive mental attitude, setting clear goals, and taking relentless action can lead to unparalleled success. Hill’s wisdom isn’t just theoretical; he draws inspiration from interviews with some of history’s most influential figures, distilling their secrets into a practical guide for anyone seeking personal and financial growth.

As we delve into the pages of “Think and Grow Rich,” prepare to explore the power of desire, the magic of belief, and the importance of persistence. This book isn’t a quick fix or a one-size-fits-all solution. It’s an invitation to unlock your potential, define your purpose, and embark on a journey toward success.

Get ready to unleash the extraordinary within you.

Think and GROW Rich - Thumbnail

Chapter 1: The Power of Thought

Chapter 1 of “Think and Grow Rich” by Napoleon Hill sets the stage for the entire book by introducing the concept of the power of thought and how it can lead to success and riches. This chapter tells the story of Edwin C. Barnes, who desired to become a business associate of Thomas Edison, and how he turned his burning desire into reality. Barnes was determined, persistent, and specific in his goal. He didn’t just want to work for Edison; he wanted to work with him.

Barnes faced obstacles like not knowing Edison personally and lacking the money to travel to meet him. However, his determination led him to take unconventional measures, like traveling on a freight train, to reach Edison’s laboratory. When he finally met Edison, despite his initial appearance, Edison saw in Barnes a man with an unwavering desire and determination. This led to Barnes eventually becoming a business partner of Edison, which not only made him rich but also validated the power of thought and desire.

The chapter also introduces the idea that when you truly desire something and are willing to stake your future on it, you are more likely to succeed.

Barnes’ thoughts and determination were more critical than his initial appearance, emphasizing the significance of mindset and belief in achieving success.

The chapter also briefly mentions the concept of persistence and how many great achievements come just one step beyond the point of temporary defeat. The story of R. U. Darby, who quit just three feet from gold, illustrates the importance of not giving up in the face of setbacks.

Finally, the chapter touches on the idea that success and failure are rooted in one’s thought habits and that changing your thoughts can lead to success. It suggests that by mastering the principles outlined in the book, one can change their mindset from failure consciousness to success consciousness and achieve their desired goals.

Overall, Chapter 1 of “Think and Grow Rich” lays the foundation for the book’s core principles and introduces the reader to the transformative power of thought and desire in achieving success and wealth. Read the full book here.

Chapter 2: Step #1 To Riches (Desires)

Chapter 2 of “Think and Grow Rich” is dedicated to the theme of desire as the driving force behind all significant achievements. Napoleon Hill illustrates this principle with a compelling personal story about his son, Blair. Blair was born without ears, which was initially seen as an insurmountable handicap. However, Hill firmly believed that desire, when combined with faith, could conquer any obstacle.

Hill’s approach to helping his son was multi-faceted.

  • First, he mixed faith with the intense desire for Blair to have normal hearing and speech. This unwavering belief served as the foundation for all subsequent actions.
  • Second, Hill communicated his desire to Blair in every conceivable way, consistently and persistently over many years. He created a mental atmosphere of faith and confidence around his son.
  • Third, Blair believed in his father’s vision for him. He accepted the possibility of normal hearing, and this belief became the catalyst for transformation.

Through a series of remarkable events and unexpected turns, Blair eventually acquired the ability to hear and speak just like any other person. Hill emphasizes that the modus operandi for achieving this incredible result consists of these three key factors: mixing faith with desire, persistent and continuous communication of the desire, and unwavering belief.

Hill’s broader message is that desire, when coupled with faith, can lead to extraordinary outcomes in life. It can transform obstacles into opportunities, lead to personal growth, and ultimately result in the achievement of one’s goals.

The chapter 2 serves as a powerful testament to the idea that nothing is impossible when desire is strong enough and backed by unwavering faith. It sets the stage for the reader to harness the power of desire as they embark on their own journey toward success and personal achievement. Read the full book here.

Chapter 3: Step #2 To Riches (Faith)

Chapter 3 of “Think and Grow Rich” by Napoleon Hill delves into the significance of faith in the context of achieving success and accumulating wealth. This chapter primarily focuses on the following key aspects:

In the chapter, Hill first highlights the substantial influence of imagination to transforming ideas into concrete realities. He underscores the crucial role of imagination in shaping the creative process and turning it into a blueprint for success. Hill substantiates this concept by narrating the compelling story of Charles M. Schwab, who masterfully translated his visionary idea into the immense reality of the United States Steel Corporation.

Hill emphasizes that faith is an indispensable component in the journey to success. He elucidates how individuals, like Charles M. Schwab, can instill faith in their ideas and effectively communicate this belief to others. Schwab’s unwavering faith in his idea played a pivotal role in its realization, particularly in convincing J.P. Morgan to support his vision.

Furthermore, the chapter underscores the importance of formulating a well-structured plan for the attainment of goals. Schwab meticulously devised a comprehensive plan to convert his idea into a thriving corporation, and he presented it with remarkable clarity and persuasiveness.

Taking action with persistence is another key theme. Schwab’s renowned speech at the University Club and his relentless commitment to executing the plan were vital factors in its eventual success.

The chapter also emphasizes the significance of nurturing a burning desire for success. Schwab’s unwavering determination and intense desire to establish the steel corporation were instrumental in his achievement.

Lastly, the chapter offers the case study of the United States Steel Corporation as a concrete example of how faith, imagination, planning, persistent action, and a fervent desire can lead to the accumulation of substantial wealth.

In essence, Chapter 3 of “Think and Grow Rich” underscores the critical role of faith in one’s ideas, the power of imagination, the necessity of formulating a clear plan, and the importance of pursuing goals with persistence and unwavering desire to attain financial success and wealth. Charles M. Schwab’s and Sir John Templeton’s experiences serve as real-world illustrations of these principles. Read the full book here.

Chapter 4: Step #3 To Riches (Auto Suggestions)

Chapter 4 of “Think and Grow Rich” discusses the concept of autosuggestion as a crucial step in influencing the subconscious mind, which is essential for achieving financial success. Autosuggestion refers to self-administered stimuli that enter the mind through the five senses. It acts as the bridge between conscious and subconscious thinking.

Thoughts, whether negative or positive, cannot enter the subconscious without the aid of autosuggestion.

The chapter emphasizes that individuals have control over what reaches their subconscious mind through their senses, but most people fail to exercise this control, leading to a life of poverty. It likens the subconscious mind to a garden that needs careful cultivation, where autosuggestion is the tool to plant thoughts of a creative or destructive nature.

The book instructs readers to read their desire for money aloud with faith and emotion, repeating it daily to create thought habits favorable to turning desire into wealth.

It highlights the importance of mixing emotion with words when addressing the subconscious mind, as plain, unemotional words have no influence.

The chapter stresses the need for persistence and concentration to make autosuggestion effective. It advises visualizing money, demanding plans from the subconscious, and taking immediate action when inspired. It warns against relying solely on reason and emphasizes the importance of faith.

In summary, Chapter 4 underscores the critical role of autosuggestion in achieving financial success, emphasizing the need for faith, persistence, and emotional involvement in the process. It is a key element in the philosophy presented in the book, providing readers with practical steps to harness the power of their subconscious mind. Read the full book here.

Chapter 5: Step #4 To Riches (Personal Experience or Observations)

Chapter 5 emphasizes the importance of specialized knowledge and its role in achieving success and prosperity. It distinguishes between general knowledge, which is abundant but often insufficient for wealth accumulation. The book states that specialized knowledge is essential when organized and applied to specific goals.

Chapter 5 challenges the notion that knowledge alone is power, asserting that knowledge becomes power when it is organized into practical plans and directed toward a specific objective. It criticizes educational institutions for not adequately teaching students how to organize and apply knowledge effectively.

The story of Henry Ford is cited as an example of a person who, despite limited formal education, achieved immense success by surrounding himself with a “Master Mind” group possessing the specialized knowledge he needed. This highlights the importance of collaboration and seeking expertise beyond one’s own.

Chapter 5 also narrates the story of Dan Halpin, who started in an undesirable job but rose to prominence by setting clear goals, working hard, and refusing to compromise with circumstances. It underscores the idea that success and failure are often the result of habits and associations.

Furthermore, it suggests a unique business opportunity for those who can help others market their services more effectively, with the potential to generate substantial income. This involves combining specialized knowledge with imagination to create personalized plans for clients seeking better-paying positions or rearranging their incomes.

In conclusion, Chapter 5 promotes the value of specialized knowledge, the significance of proper planning, and the potential for individuals to thrive by applying their talents and knowledge strategically. Read the full book here.

Chapter 6: Step #5 To Riches (Imagination)

Chapter 6 emphasizes the transformative power of ideas, determination, and the creative use of imagination in achieving success and wealth. It starts by recounting the story of Dr. Frank W. Gunsaulus, a young preacher who went from vague thoughts about a million dollars to a firm decision to obtain it within a week. His determination and definite purpose attracted the necessary funds, illustrating the principle that ideas can be transmuted into cash through the power of definite purpose and definite plans.

The narrative goes on to highlight other successful individuals, such as Andrew Carnegie and Herb Kelleher, who recognized the value of ideas and the importance of selling those ideas. It stresses that riches do not result from hard work alone but from the application of definite principles and a clear, focused desire.

Chapter 6 also discusses how ideas can be marketed effectively, with examples like changing a book’s title to boost sales and the role of imagination in recognizing opportunities. It underscores the significance of developing and nurturing ideas until they become powerful forces in their own right.

Ultimately, Chapter 6 encourages readers to believe in the potential of their ideas, be determined in their pursuit of success, and understand that success is not a matter of luck but a result of deliberate action, guided by clear goals and a burning desire to achieve them. Read the full book here.

Chapter 7: Step #6 To Riches (Organized Planning)

In Chapter 7 of Napoleon Hill’s “Think and Grow Rich,” the author explores the crucial role of organized planning in achieving success and wealth. I remember this chapter as three main sections, each highlighting distinct aspects of organized planning and its significance.

1. Self-Analysis and Goal Setting

Hill begins by emphasizing the importance of self-analysis as a foundation for organized planning. He introduces a set of 28 self-analysis questions that prompt readers to evaluate various aspects of their lives, including their persistence, decision-making, fears, relationships, habits, and ability to provide service. This introspection aims to help individuals identify areas for improvement and align their goals with their values and aspirations.

2. The Power of Capital in Wealth Accumulation

The chapter shifts its focus to the role of capital in wealth accumulation and the functioning of society. Hill underscores that capital represents more than just money—it encompasses highly organized groups of people with diverse expertise, such as scientists, educators, inventors, and business analysts. These individuals work collectively to provide valuable goods and services to society. Hill dispels misconceptions about capitalism, highlighting its essential role in driving progress and prosperity.

3. Opportunities for Wealth Accumulation

Hill closes the chapter by exploring the myriad opportunities available in a capitalistic society for individuals to accumulate wealth. He stresses that the only legitimate method to gain riches is by providing useful service in exchange for an equivalent value. This involves participating in various sectors of the economy, from manufacturing and transportation to marketing and services. Hill encourages readers to leverage their talents, skills, and hard work within this system to attain financial success.

In summary, Chapter 7 of “Think and Grow Rich” underscores the significance of organized planning as a path to success. It begins with self-analysis to align personal goals with strengths and weaknesses, emphasizing the critical role of organized capital in modern society. Finally, it highlights the abundance of opportunities for wealth accumulation within a capitalistic framework, providing individuals are willing to contribute value through their efforts and expertise. Read the full book here.

Read More

Redington Is Trading at A PE of 9.45 | Is This An Undervalued Stock?


To understand if Redington’s Stock is undervalued or not, we must first look into its business. On the face of it, the company looks like a typical IT company, but it is not. Looking at its business model will tell us why a strong-looking company like Redington trades at a PE multiple of below ten (10).

Do you know what the revenue of Infosys is? about Rs.150,000 crore. What is the revenue of Redington? about Rs.79,000 which is about 52% of Infosys.

Now let’s look at their Market Cap. Infosys has a market cap of about Rs.608,000 crore. If Redington follows the same 52% rule, its market cap should be about Rs.316,000 crores. But do you know what is the actual market cap of Redington? It is only about Rs.13,000 crores.

Persistent Systems has revenue of only about Rs.8,400 crores (23% of Redington) but its market cap is close to Rs.44,500 crore (3.4 times that of Redington).

This is why I’m referring to Redington as not a typical IT company. Considering Redington’s current income streams, it can best be described as a special trading company.

So in a way, we can say that, we cannot expect Redington to trade at the P/E levels of our IT stocks. We’ll also do the intrinsic value calculation for the company. It will actually decide, if at current PE levels, the stock is actually undervalued.


Business Model

Redington India is involved in the IT and technology industry. They have a diverse business model that includes the distribution and sale of various products, including laptops, desktops, printers, smartphones (referred to as Mobility), and cloud services.

Redington India is one of the authorized distributors and service providers for Apple products in India. They are responsible for distributing Apple products, including iPhones, iPads, Macs, and accessories, to various retailers and resellers in the Indian market. Additionally, they provided after-sales support and services for Apple products through their authorized service centers.

Like Apple, Redington also works as a distributor of hardware and software products of Microsoft, HP, Lenovo, Google Pixel, Samsung, Dell, IBM, Acer, Toshiba, etc.

Redington had partnerships with various technology companies to offer cloud services to its clients. Some of the major cloud service providers that Redington India could have partnered with for offering cloud solutions include:

  • Microsoft Azure.
  • Amazon AWS.
  • Google Cloud Platform.
  • IBM Cloud, etc.

Revenue Streams

The three main revenue streams of Redington are these:

  1. Volume I.T: This segment includes the distribution of products such as tablets, laptops, desktops, and printers. This business is approximately one-third (about 35%) of the total revenue of Redington.
  2. Mobility Business: It includes the distribution of smartphones which is another revenue stream. About 20% of the total revenue of Redington comes from this segment. It has been one of the fastest-growing business segments for Redington. However, it is also worth noting that Apple is one of the key suppliers to Redington who opened their own retail stores in Mumbai and New Delhi in April this year (2023).
  3. Enterprise I.T (Information Devices): This is another segment of their business, and it typically includes higher-end IT products and services tailored for enterprises and businesses. This business segment operates at a margin that is approximately 2% points higher than the volume I.T and Mobility business.

To support the above three main business verticals, Redington offers the following services as well:

  • Value-added services: Redington provides value-added services, such as installation, configuration, and maintenance of IT products.
  • Logistics and supply chain management: Redington provides logistics and supply chain management services to its customers and suppliers. Redington has their own warehouse services. This helps suppliers and customers manage their inventory and ensure that they have the right products at the right time.

Margin

Redington’s EBITDA margins were reported at 2.5% in the Q4 of FY 2022-23.

EBITDA margins were 2.7% in Q3 and 2.8% from the same period in the previous year (FY 2021-22)

The company has indicated that by Q4 of FY 2023-24, the margins will improve and guide that they will likely be between 2.6% to 2.9%.

This is the reason why the P/E Ratio of Redington trades at a low PE ratio. The EBITDA margin for typical companies in the Indian IT sector (TCS, Infosys, Wipro, etc.) is typically around 20%. But Redington does business at an EBITDA margin of below 3%.

That is why, though it works in the IT space, it is not our typical IT company. So expecting that, someday, its PE will also become 25-30X is farfetched and looks unrealistic today.

Other Aspects of Business

  1. Redington India faced margin pressure due to market contraction and pressure on inventory and stock liquidation. This is one reason why in FY 2022-23, its debt-to-equity ratio (D/E)swelled.
  2. The company experienced strong revenue growth of 26% on a year-on-year basis, even though there were challenges in the market.
  3. The drop in demand for home devices (such as laptops and tablets) due to reduced work-from-home and learn-from-home trends contributed to inventory build-up in FY 2022-23 (its effect on cash flow report).
  4. There is an expectation that the pressure on inventory will ease in the upcoming fiscal year in the coming quarters as the demand for volume IT products will increase.
  5. Redington India operates in multiple geographies, including India, Singapore, the Middle East, South Asia, Africa, Turkey, etc. with an expectation of continued growth in these markets.
  6. The company’s focus on cloud services appears to be paying off with robust growth in this segment .

Latest Price Trend

In the last 90 days, the stock price has corrected by almost 11%. In July’23, its stock price was at Rs.190 levels. But today it is trading at Rs.165 levels. Hence, I thought to present to you a fundamental analysis of the company. I’ll present to you a quick intrinsic value estimation of the company.

Overall, my Stock Engine gives it an overall score of 79 out of 100. This is another motivation for me to do a self-check of its intrinsic value.

Intrinsic Value

Intrinsic value, in the context of finance and investing, refers to the true, inherent worth of an asset, such as a stock, bond, or company. It is often used in fundamental analysis to assess whether an investment is overvalued or undervalued based on a set of fundamental factors and calculations. The concept of intrinsic value is most commonly associated with stocks, where it is used to determine whether a stock’s current market price is justified by its underlying fundamentals.

Here are some key points about intrinsic value:

  1. Fundamental Analysis: Calculating intrinsic value involves analyzing a range of fundamental factors, such as earnings, cash flows, dividends, growth prospects, and risk. The goal is to estimate the future cash flows that an investment is expected to generate.
  2. Discounted Cash Flow (DCF) Analysis: The most widely used method for estimating the intrinsic value of a stock is the discounted cash flow (DCF) analysis. This approach involves forecasting the future cash flows the investment will generate and then discounting them back to their present value using a discount rate that reflects the investment’s risk.
  3. Relative Valuation: In addition to DCF analysis, investors may also use relative valuation methods, such as comparing the stock’s price-to-earnings (PE) ratio or price-to-book (PB) ratio to industry averages or peer companies. These methods provide a relative perspective on whether the stock is undervalued or overvalued.
  4. Margin of Safety: Intrinsic value is often used to determine a “margin of safety.” This means that an investor would consider buying a stock when its market price is significantly below its estimated intrinsic value. The larger the margin of safety, the lower the risk of overpaying for the investment.
  5. Subjective Factors: Estimating intrinsic value is not an exact science, and it involves making assumptions about future variables like growth rates and discount rates. These assumptions can be subjective and vary between analysts, which is why different analysts may arrive at different intrinsic value estimates for the same asset.
  6. Long-Term Perspective: Intrinsic value analysis is typically associated with long-term investing. It assumes that over time, market prices tend to converge toward intrinsic value as market participants become more rational and informed.

It’s important to note that intrinsic value is just one tool in an investor’s toolkit. It does not guarantee that a stock’s market price will align with it in the short term, as market prices can be influenced by various factors, including investor sentiment and market dynamics. However, over the long term, many investors believe that buying assets when they are undervalued relative to their intrinsic value can lead to successful investment outcomes.

I tried calculating the free cash flow of Redington taking numbers from its cash flow report. But it came negative for the current year. But if we look at the last 10 years’ cash flow data, it looks like, on average the company’s operation stayed cash flow positive. Hence, I’m trying a new approach to estimate the intrinsic value of this company.

Redington can collect about 40% of its PBT in the same year.

Redington Ltd - Cash FLow Analysis

Redington being in a trading business, I’m assuming that it will not invest more than 15% of its PBT into CAPEX.

I’ll also assume a one-year forward PBT of Redington as Rs.2000 crores (FY 2024-25). Out of this PBT, it will convert about 40% of it (Rs.800 crore) as net cash flow from operations. If we take 15% of PBT as Capex (Rs.300 crores), the free cash flow to the firm (FCFF) will be Rs.500 crores.

Free Cash Flows To Equity (FCFE)


In the last 10 years, the company generally carried a debt of about Rs.1500 crores. But last year it had more than double the average debt on its balance sheet. It was an unprecedented situation as explained in SL.3 here.

For free cash flow to equity (FCFE) calculation, we take only 20% of debt into consideration (as a factor of safety). Hence, FCFE will look like this:

FCFE = FCFF + Debt = 500 + 300 = 800 Crores.

This way, the FCFE of the company comes out to be Rs.800 crores.

The free cash flow to equity (FCFE) of the company is Rs.800 crores.

Normal Period Growth Rate (Gnp)

In the last five years, the company’s ROE has increased from 13% to 20%. I’m assuming that it will remain at 20% levels in the coming years.

The company pays about 36% of its net profit (PAT) as dividends to its shareholders.

So this way, the sustainable growth rate (SGR = Gnp) of the company will be about 12.6% per annum.

Future Free Cash Flows

We’ve estimated that the present free cash flow to equity (FCFE) of the company is Rs.800 crores. In the next five years, the FCFE of the company will grow at about 12.6% per annum.

I have also assumed the following to calculate the terminal value (TV):

Taking these numbers as our basis future free cash flows for the next five years come out to be as follows:


Present Value of Future Cash Flows

At the discount rate of 10% per annum, the sum of present values (PV) of the above free cash flows comes out to be Rs.18,658 crores.

The company has issued about 78.16 crore number shares in the market.

This way, its intrinsic value per share will be as below:

  • The sum of PV = Rs.18,658 crores.
  • Nos. of Shares = 78.16 crores.
  • Intrinsic Value / Share = Rs.238 per share.

This being a trading company with its own set of challenges, I’ll apply a standard two-thirds margin of safety to my estimated intrinsic value.

Applying this margin of safety, I’m assuming that a fair buy price for this stock will be about Rs.160 per share.

Conclusion

I know that Redington is not a typical IT stock and this is why it is trading at an EBITDA Margin of 2.5%.

I also know that in coming years, the company will have to diversify its business, as (maybe), its revenue from Apple’s products may fall. But it can be made up through value-added services (Cloud computing etc.). But it will take time (like 10 years).

It is a company in which the promoter’s holding is zero percent. But there are some top Indian companies like L&T and ITC where we can see the same behavior. Generally, I like companies, where the promoter’s holdings are high. But it is not a deal-breaker for me.

But I like the management of this company. The way they present their annual reports looks transparent, professional, and ethical.

I’ve tried to factor in all the negatives of the company while estimating its intrinsic value. My estimation is (it is for myself, not to be treated as an investment advice) as Rs.160 per share.

Its current stock price (Rs.166 per share) is already very close to my estimates.

I’m adding this stock to my watchlist.

Redington Is Trading at A PE of 9.45 | Is This An Undervalued Stock?

A Price-to-Earnings (PE) ratio of 9.45 is just one factor to consider when evaluating whether a stock is undervalued or not. While a low PE ratio may suggest that a stock is undervalued, it should not be the sole determinant in your analysis. Here are a few points to consider when evaluating whether Redington is undervalued:

  1. Industry Comparison: It’s essential to compare Redington’s PE ratio to the average PE ratio of other companies in the same industry. A lower PE ratio compared to its industry peers could indicate relative undervaluation.
  2. Growth Prospects: Evaluate Redington’s growth prospects. If the company is expected to have strong future earnings growth, a lower PE ratio may be justified. Conversely, if growth prospects are limited, a low PE ratio might not necessarily indicate undervaluation.
  3. Earnings Stability: Consider the stability of Redington’s earnings. If earnings are consistent and predictable, a low PE ratio may be more reliable in indicating undervaluation. However, if earnings are volatile or uncertain, the PE ratio may not be as informative.
  4. Financial Health: Assess the company’s financial health, including its balance sheet, debt levels, and cash flow. A company with a strong financial position may justify a higher PE ratio.
  5. Market Conditions: Economic and market conditions can also influence whether a PE ratio is considered undervalued or not. In a bear market or during economic downturns, PE ratios across the board may be lower due to increased investor caution.
  6. Qualitative Factors: Don’t rely solely on quantitative metrics like PE ratios. Consider qualitative factors such as the company’s competitive position, management quality, and industry trends.

It’s important to perform a comprehensive analysis, considering these factors and more, to determine whether Redington is undervalued or not. Additionally, it’s a good practice to consult with financial professionals or conduct thorough research before making any investment decisions, as the stock market can be influenced by various factors that may not be immediately apparent from a single metric like the PE ratio.

[contact-form][contact-field label=”Name” type=”name” required=”true” /][contact-field label=”Email” type=”email” required=”true” /][contact-field label=”Website” type=”url” /][contact-field label=”Message” type=”textarea” /][/contact-form]

Economics of Driving Electric Vehicles (EVs) Over Petrol/Diesel Cars [Cost Analysis]


My father has a VW Polo petrol since 2016. Being a retired man, he does not drive much. But he wants to get rid of the hassle of going to fuel stations to get the car refueled. Moreover, he also wants to contribute (carbon Footprint) by switching to an EV. Hence, he proposed to change the car from Petrol to an EV. Being an Ex Tata, the Tata Nexon EV Max (2023) is his pick. So I thought to check the economics of driving electric vehicles (EVs).

People who are looking to change cars now are definitely considering the option of an Electric Vehicle (EV). This is more relevant to those buyers whose preference is a hatchback or a compact SUV. Currently, there are budget EVs on offer by Tata and Mahindra. These cars are available at an on-road price ranging between Rs.12 to Rs.20 Lakhs.

Comparing the cost of purchase of EVs with their Petrol and Diesel Automatic variants, petrol and diesel cars are 30% cheaper. However, the cost of charging and maintenance of EVs is very low.

So, on one side we have EVs whose one-time purchase cost is about 30% higher. Then there are petrol and diesel cars whose cost of refueling is about 4 times higher than that of EVs.


So the question is, which is more cost-effective, EVs or traditional cars? Let’s answer it.

The economics of driving electric vehicles (EVs) are influenced by various factors, and they can offer several financial advantages compared to traditional gasoline or diesel-powered vehicles. Here are some key economic considerations when it comes to EVs:

  1. Fuel and Operating Costs:
    • Lower Fuel Costs: EVs are generally cheaper to fuel compared to internal combustion engine (ICE) vehicles. Electricity is often less expensive than gasoline or diesel on a per-mile basis.
    • Maintenance Savings: EVs have fewer moving parts than ICE vehicles, resulting in lower maintenance costs. There is no need for oil changes, and brake wear is reduced due to regenerative braking systems.
  2. Purchase Price and Incentives:
    • Initial Cost: While the purchase price of some EVs can be higher than their ICE counterparts, this gap is narrowing as technology advances and economies of scale come into play.
    • Government Incentives: Many governments offer financial incentives to encourage EV adoption, such as tax credits, rebates, or reduced registration fees. These incentives can significantly reduce the upfront cost of an EV.
  3. Resale Value:
    • Depreciation: EVs often experience faster initial depreciation compared to ICE vehicles. However, their resale value can stabilize and even improve over time as the market matures and demand for used EVs increases.
  4. Charging Infrastructure:
    • Charging Costs: Home charging is convenient and cost-effective, but the availability and cost of public charging stations can vary by location. Understanding the charging infrastructure in your area is essential for cost management.
  5. Range and Battery Life:
    • Battery Degradation: Over time, EV batteries can experience degradation, which reduces their capacity and range. Manufacturers typically provide warranties that cover battery performance for a certain number of years or miles.
  6. Environmental Benefits:
    • Emissions and Sustainability: EVs produce zero tailpipe emissions, which can lead to environmental benefits and may result in long-term cost savings related to environmental regulations and carbon pricing.
  7. Total Cost of Ownership (TCO):
    • Consider the TCO of an EV over its lifespan, factoring in purchase price, fuel or electricity costs, maintenance, incentives, and resale value. TCO analysis can help determine whether an EV is cost-effective for your specific circumstances.
  8. Driving Patterns:
    • Assess your daily driving habits, including commuting distances and travel frequency. EVs are well-suited for daily commuting and short to moderate-distance travel. Longer trips may require more planning due to charging infrastructure limitations.
  9. Financial Considerations:
    • Evaluate your budget, financing options, and the availability of loans or leases for EVs. Consider how an EV purchase fits into your overall financial plan.
  10. Insurance Costs:
    • Insurance rates for EVs can vary depending on factors like the make and model of the vehicle, your driving history, and location. Compare insurance quotes to find the best rates.

In summary, the economics of driving electric vehicles can be favorable due to lower operating costs, potential government incentives, and environmental benefits. However, the decision to switch to an EV should be based on your individual circumstances, including your budget, driving patterns, and access to charging infrastructure. Conducting a thorough cost analysis and considering the long-term benefits can help you make an informed decision about whether an EV is right for you.

Requirement

There are two use cases of cars for us. The first is for office commuting and the second for long trips. I’m not considering the use case of cars as a taxi.

  • Office Commute: The car is mainly used for office commuting within the city. To travel longer distances, there is another car available. For such a use case, I’m assuming a budget EV with a range of 200 KM will be sufficient.
  • Long Trips: Here the car is also used for longer trips, say on weekends. For this type of use, I’m assuming a budget EV with a range of 350 KM will be necessary.

Our next step will be to select a budget EV that matches the above two requirements.

Car Selection

Primarily, we’ll consider only the budget EVs available in the market. We’ll pick only that EV whose Petrol/Diesel variants are also available. This way, we can make an apple-to-apple comparison.

  • Office Commute: For this type of commute, we can pick Tata Nexon EV Prime. This car can offer a range of about 250 km on a full charge. If the person wants to avail a more economical car, then the Tata Tiago EV is a more budget-friendly car with a range of 210 Km.
  • Long Trips: For this type of commute, we will pick the Tata Nexon EV Max. Its range on full charge is 350 km. Here I’m assuming that a long trip is about 150 km on one side.

These EVs will be compared with two similar cars running on traditional fuels, Tata Nexon Petrol AMT and Diesel AMT.

Please note that EVs inherently have an automatic transmission. Hence to have an even match of cars from the Petrol and Diesel segments, I’ve referred only to the automatic variants (AMT) for comparison purposes.

Cost of Driving A Car

To calculate the cost of driving a car, we’ll use four parameters:

  1. On-road cost of the brand new car (purchase cost).
  2. Refueling cost the car (for 5 years).
  3. Servicing cost of the car (for 5 years).
  4. Comprehensive insurance cost (for 5 years).

Using these costs as our basis, we will calculate the cost of owning the car for a five-year period. In these five years, only the cost of purchasing a new car is a one-time expense. All the other three costs are of recurring in nature.

I’ve assumed only a five-year period as ownership because I’m assuming that the battery health will be best during this period only. After five years, the charging speed and charge retention quality will substantially go down. Hence, the end of the fifth year is the time to change the car.

Petrol and Diesel Car [With Online Calculator]

Economics of Driving Electric Vehicles (EVs) - Petrol Diesel Car Cost

In this section, we’ll calculate the cost of driving a petrol and a diesel car. In this calculation, I’ve assumed the following:

  • Car Make and Model: Tata Nexon
  • Years for this the car is used for commuting: 5 Years
  • Kilometer run each year: 6,000 KM
  • Fuel Efficiency (Km/Ltr): 12 (petrol) and 13.5 (diesel)
  • Fuel Rate (Rs./Ltr): 110 (petrol) and 95 (diesel)
  • Service cost (Rs./year): 8000 (petrol) and 9500 (diesel)
  • Insurance (IDV): Average for 4 years 55% of the on-road cost
  • Insurance (Premium): 1.91% of IDV

With these as our assumption, the total cost of driving petrol and diesel cars is as below:

. Car Brand Tata Nexon Tata Nexon
. Transmission Petrol-AMT Diesel-AMT
. Model XZA Plus LUXS DT XZA Plus LUXS DT
A Fuel Cost / 5 Yrs Rs. 2,75,000 2,11,111
B Service Cost / 5 Yrs Rs. 40,000 47,500
C Avg. Insurance Cost / 5 Year Rs. 65,467 73,661
D On Road Cost Rs. 15,58,000 17,53,000
. Toatal Cost (A+B+C+D) Rs. 19,38,467 20,85,272
  • Tata Nexon Petrol (AMT): The on-road cost of this car is about 15,58,000. Taking into consideration the kilometers run, fuel consumption, annual maintenance, and insurance cost, the total cost to run this vehicle for five (5) years, is about Rs.19,38,467.
  • Tata Nexon Diesel (AMT): The on-road cost of this car is about 17,53,000. It is 12.5% more expensive than the Petrol variant. Though the total cost of refueling the diesel car variant, in a 5-year period, is 23% less than petrol. But the car is also expensive in terms of servicing cost and insurance. Hence, the total cost to run this vehicle for five (5) years, is about Rs.20,85,272 (7.5% higher than its petrol variant).

EV – Electric Vehicle [With Online Calculator]

Electric Vehicle Ownership Cost Calculator - Screenshot2
An Electric Vehicle (EV) is a type of vehicle that is powered by electricity rather than internal combustion engines (ICEs) fueled by gasoline or diesel. EVs use electric motors and rechargeable batteries or other energy storage devices to propel the vehicle and provide power to accessories. They are known for their environmental benefits and energy efficiency. Here are some key points about electric vehicles:

  1. Types of Electric Vehicles:
    • Battery Electric Vehicles (BEVs): These vehicles are solely powered by electricity stored in high-capacity batteries. They have no internal combustion engine and produce zero tailpipe emissions.
    • Plug-in Hybrid Electric Vehicles (PHEVs): PHEVs combine an electric motor with a gasoline or diesel engine. They can be charged from an external source and operate on electricity for a limited range before the internal combustion engine takes over.
    • Hybrid Electric Vehicles (HEVs): HEVs have both an electric motor and an internal combustion engine, but they cannot be charged externally. The electric motor assists the engine to improve fuel efficiency.
  2. Benefits of Electric Vehicles:
    • Zero Emissions: BEVs produce no tailpipe emissions, contributing to reduced air pollution and greenhouse gas emissions.
    • Energy Efficiency: EVs are highly energy-efficient, with a significant portion of the energy from the electricity grid converted into vehicle movement.
    • Reduced Operating Costs: EVs generally have lower operating costs compared to ICE vehicles due to lower fuel costs and reduced maintenance requirements.
    • Quiet Operation: EVs are quieter than traditional vehicles, reducing noise pollution in urban areas.
  3. Charging Infrastructure:
    • EVs are typically charged using electric vehicle charging stations, which can vary in speed and availability. Charging options include home charging, workplace charging, and public charging stations.
  4. Range: The distance an EV can travel on a single charge depends on the vehicle’s battery capacity. Advances in battery technology are continually increasing the range of EVs.
  5. Government Incentives: Many governments offer incentives to promote the adoption of electric vehicles, including tax credits, rebates, and reduced registration fees.
  6. Environmental Considerations:
    • While EVs produce no tailpipe emissions, the environmental impact depends on the source of electricity generation. EVs are cleaner when charged using renewable energy sources.
    • Battery production and disposal also have environmental considerations, including resource extraction and recycling.
  7. Market Growth: The adoption of EVs is growing globally, with many automakers investing in EV development and expanding their electric vehicle model offerings.
  8. Cost Considerations: While the upfront cost of some EVs can be higher than that of traditional vehicles, lower operating costs and potential incentives can offset the initial investment.
  9. Maintenance: EVs typically require less maintenance than ICE vehicles because they have fewer moving parts, no need for oil changes, and regenerative braking systems that reduce wear on brakes.

Electric vehicles play a crucial role in reducing the environmental impact of transportation and transitioning to a more sustainable and clean energy future. As technology continues to advance and charging infrastructure improves, the adoption of EVs is expected to increase, making them a significant part of the automotive landscape.

Click Here For The Calculator

Economics of Driving Electric Vehicles (EVs) - Cost of Driving EV

In this section, we’ll calculate the cost of driving an electric vehicle (EV). In this calculation, I’ve assumed the following:

  • Car Make and Model: Tata Nexon EV (Prime & Max)
  • Years for this the car is used for commuting: 5 Years
  • Car’s ability to run on full charge (KM): 250 (Prime), 350 (Max)
  • Battery Capacity (KWH): 30.2 (Prime), 40.5 (Max)
  • Charging Efficiency of Battery: 88%
  • Electricity Rate (Rs./unit): 10
  • Service cost (Rs./year): 8000
  • Insurance (IDV): Average for 4 years 55% of the on-road cost
  • Insurance (Premium): 1.91% of IDV

With these as our assumption, the total cost of driving an electric vehicle (EV) looks like below:

. Car Brand Tata Nexon Tata Nexon Tata Tiago
Transmission EV-Prime-AT EV-Max-AT EV-AT
Model XZ Plus LUX XZ Plus LUX XZ Plus LUX
A Fuel Cost / 5 Yrs (X) Rs. 41,182 39,448 38,961
B Service Cost / 5 Yrs (Y) Rs. 40,000 40,000 30,000
C Avg. Insurance Cost / 5 Year Rs. 90,381 99,817 53,996
D On Road Cost (Z) Rs. 18,20,000 20,10,000 12,85,000
. Total Cost (A+B+C+D) Rs. 19,91,563 21,89,265 14,07,957

Conclusion #1 (Short Trips)

Let’s look at the economics of driving electric vehicles (EVs). For that, we’ll compare the cost of running EVs over petrol and diesel cars.

  • Tata Nexon EV (Price): The on-road cost of this car is about 18,20,000 (16.8% higher than the Petrol variant). However, the total cost of charging the batteries, in a 5-year period, is 85% less than the cost of refueling its petrol variant (Rs.41,182 vs. Rs.2,75,000). The car is also cheap in terms of servicing cost and insurance. Hence, the total cost to run this vehicle for five (5) years, is about Rs.19,91,563 (only 2.7% higher than petrol).
  • Tata Nexon Diesel (AMT): The on-road cost of this car is about 20,10,000 (29% higher than the Petrol variant). However, the total cost of charging the batteries, in a 5-year period, is 85.6% less than the cost of refueling its petrol variant (Rs.39,448 vs. Rs.2,75,000). The car is also cheap to service and get insured. But still, the total cost to run this vehicle for five (5) years, is about Rs.21,89,265 (13% higher than petrol).

So we can conclude that if the average run of the car is about 6000 Kilometers in a year, a petrol car is still more cost-effective. Though the Nexon EV (Prime) is proving only 2.7% costlier than Petrol.

So for people who want to use their cars only for office commuting, where the average commute per year is close to 6000 km a day, a Tata Nexon Petrol is best. But if you are okay with spending that 2.7 % extra in a 5-year period, Tata Nexon EV (Prime) is also a suitable option.

A better car for office commuting is Tata Tiago EV. The cost of running this car is a 5-year period, is 27.4% less than even Tata Nexon Petrol (AMT). What makes this car moe cost effective for everyday office commuting is its lower on-road cost. Though it must be kept in mind that Tata Tiago will only go about 210 Km on a full battery. Hence, it is only suitable for shorter rides withing the city.

Conclusion #2 (Long Trips)

For people who cannot compromise on long hauls with their Electric Cars (EVs), a more suitable option is the Tata Nexon EV (Max). Though the total cost of purchasing, running, maintaining, and insuring this car is higher (10% more) than the EV-Prime, still it is a better buy. The EV-Prime has only a 250 Km range compared to the 350 Km range of the EV-Max. For long trips on expressway types of roads, the range of 350 Km is more apt.

Conclusion #3 (Higher Kilometers Per Year)

What happens if a person covers more than 6000 kilometers in a year? Will the situation remain the same? Petrol cars will still dominate the EVs and Diesel cars?

Economics of Driving Electric Vehicles (EVs) - KM wise comparison

For people who use their cars for more than 7,000 km in a year, the Tata Nexon EV-Prime becomes a more economical car than its Petrol variant. Above 13,000 Km in a year, the Tata Nexon EV-Max has become the second most affordable car.

But if someone is not bent on using their EV car for long drives, the most economical car in this case becomes the Tata Tiago EV.

Have a happy investing

Economics of Driving Electric Vehicles (EVs) Over Petrol/Diesel Cars [Cost Analysis]

[contact-form][contact-field label=”Name” type=”name” required=”true” /][contact-field label=”Email” type=”email” required=”true” /][contact-field label=”Website” type=”url” /][contact-field label=”Message” type=”textarea” /][/contact-form]

Mutual Fund Loss Booking: Our Guide to Portfolio Return Calculation


 ds is a popular choice. People seek to invest in them to grow wealth faster. Their benefit is that they offer diversification, professional management, and attractive returns. However, what many of us may not realize is that mutual funds are also not immune to market volatility. They also have to book losses. Knowing about how mutual fund loss booking is managed can teach us how to deal with bad stocks in our portfolio.

How do mutual funds handle losses? How do these factors influence the calculation of their overall portfolio’s returns? I’ll try to demystify how mutual fund loss bookings are accounted for. We’ll discover how they calculate the portfolio’s returns (CAGR) after they have booked losses.

We will try to look into the mind of a fund manager and see how he/she deals with bad stocks and the associated loss bookings. We, as savvy retail investors, can learn from these managers to deal with bad stocks in our stock portfolio. Our yardstick of whether our stock portfolio is good or not is the annualized returns (CAGR), right? How to calculate the CAGR of our portfolio after booking losses?

It is not a topic on which you would’ve read much before. But upon reading this piece you will definitely get a new perspective on how one can calculate annualized returns on our stock portfolioYou’ll also learn why loss booking in our stock portfolio is ok, even expert mutual fund managers do it.

Let’s know more about this topic.

Mutual Fund Loss Booking - Thumbnail

A Mutual Fund Portfolio and Loss Booking

Suppose there is a mutual fund scheme that has collected a total sum of Rs.100 Crores from various investors. Out of these Rs.100 crore, the following are the distribution of the funds:

  • Rs.50 Crore is invested in various stocks.
  • Rs.38 Crores is available as cash in the bank.
  • Rs.12 Crores were lost as and when losses were booked upon selling stocks.

Suppose, the current market value of the invested amount (Rs.50 Crores) is Rs.165 crores. The average period for which the invested money has stayed invested is about 4.5 years.

How this mutual fund scheme will calculate the annualized return generated by its investment portfolio?

  • Please Note: The mutual fund has collected Rs.100 crores. Now, they have about Rs.165 crores as the market value of the invested corpus and Rs.38 crores in cash. Even if everyone decides to withdraw the money today, the mutual fund can give them back Rs.203 Crores (=165+38) on the collected Rs.100 Crores. The period for which the money has stayed invested is 4.5 years.


Portfolio Return Calculation After Loss Booking [Steps]

An experienced mutual fund manager understands the importance of reporting annual returns accurately. It should be in compliance with SEBI regulations.

In our case, the mutual fund has collected Rs.100 crore from investors, and the current value of the invested corpus is Rs.165 crore. Cash worth Rs.38 Lakhs is also available in the bank.

To calculate and report the annual return for the 4.5-year period, the mutual fund scheme will use the following steps:

Step #1: Calculate the Total Value of the Scheme

The Total Value of the scheme will have two components. The first will be the current market value of the invested Corpus. In our example, how much is the invested corpus? The invested corpus is represented by a portfolio of stocks bought at a total sum of Rs.50 crores.

The current value of the invested corpus is valued at about Rs.165 crores. This is calculated as the total number of shares of each stock multiplied by their current prices.

The second component will be the cash holding. In our example, the cash holding lying in the bank account is about Rs.38 crores.

This way, the total value of the scheme is Rs.203 crore. (Rs.165 + Rs.38).

Step #2: Calculate the Absolute Return

The mutual fund schemes also report absolute returns. The absolute return of a mutual fund portfolio is the net gain or loss expressed as a percentage. It measures the performance irrespective of external benchmarks, reflecting the fund’s standalone profitability.

The formula to calculate the absolute Return is this,

= Total Value of Scheme – Collected Funds) / Collected Funds.

Absolute Return = (Rs.203 Crores – Rs.100 Crores) / Rs.100 Crores

Absolute Return = Rs.103 Crores / Rs.100 Crores = Absolute Return ≈ 1.03 or 103%

Step #3: Calculate the Annualized Return

The annualized return of a mutual fund portfolio calculates the average annual gain or loss. It enables the investors to assess the compound growth rate over a specified period. This type of reporting of returns facilitates performance comparisons between two mutual fund schemes.

Annualized returns also account for investment duration. Hence, it allows the investors to evaluate the long-term growth potential of a scheme more accurately.

For investors, annualized returns are more useful than absolute returns. Why? Because It considers the time value of money and investment duration. Hence, it provides a more accurate picture of long-term growth potential.

Suppose there are two mutual funds. One reports an absolute return of 100%, but it took 8 years for the fund to yield these returns. The second mutual fund scheme reports an absolute return of only 55%, but it took only 3.5 years to reach the stage. What do you think, which mutual fund has yielded better returns?

To answer this question, one must calculate their annualized returns. For the first scheme, the annualized return is 9.1% and for the second scheme, it is 13.3%. Hence, the second scheme has yielded better returns.

The Formula:

Annualized Return = [(1 + Absolute Return) ^ (1 / Investment Period) – 1]

Now, let’s calculate the annualized return:

In our example, the mutual fund has yielded an absolute return of 103%.

Hence, Annualized Return = [(1 + 1.03) ^ (1 / 4.5) – 1]

Annualized Return ≈ (2.03)^(0.222) – 1

Annualized Return ≈ [1.1703 – 1] ≈ 0.1703 or 17.03%

So, our example scheme should report an annualized return of approximately 17.2% for the 4.5-year period.

This calculation takes into account the initially collected funds, the current value of the invested corpus, and the cash holdings. The calculation also considers the time period for which the money has been invested.


Why Mutual Funds May Sometime Book Losses

Mutual fund schemes do encounter situations where they may need to sell their stock holdings at a loss.

Let’s get some insights into this practice:

#1. Risk Management

Example: Suppose there is a mutual fund that holds shares of a technology company. Due to unexpected industry-specific challenges or a poor quarterly earnings report, the stock price of that company begins to decline rapidly. To limit further losses and protect investors, the fund’s portfolio manager can decide to sell the stock at a loss. He will then reallocate the redeemed capital to other stocks or keep them as cash for some time.

#2. Portfolio Rebalancing

Example: Suppose, a balanced mutual fund has a target allocation of 60% in stocks and 40% in bonds. After a prolonged bull market, the equity portion of the portfolio has grown to 70% of the total assets. To bring the allocation back in line with the fund’s objectives, the portfolio manager will have to sell some stocks, even if it means realizing losses. The redeemed capital will be allocated to debt instruments like bonds or deposits. Sometimes, a portion can also be left idle as cash.

#3. Tax Considerations:

Example: Suppose, towards the end of the calendar year, a mutual fund, internally by themselves, not at the behest of unit holders, has booked significant gains in certain stocks (sold stocks at profit). In this scenario, where a mutual fund scheme has redeemed a few units for profits (or received dividends), they are responsible for paying capital gains tax on the booked profits.

To offset these gains and reduce the fund’s tax liability, the portfolio manager strategically sells other non-performing stocks in the portfolio at a loss. This loss harvesting helps minimize the tax impact on the fund’s investors.

#4. Changing Market Conditions:

Example: Suppose, a mutual fund holds shares in a company operating in a cyclical industry. The portfolio manager initially invested in the company during a period of economic growth. But economic conditions have changed, and a recession is looming. Recognizing that the company’s stock may suffer further losses in a recession, the manager can decide to sell the position to protect the fund’s performance. The proceeds from the same will be further reinvested or kept as cash till the next opportunity.

#5. Fund Redemption and Liquidity Needs:

Example: Suppose, in response to a sudden market downturn, many investors in a mutual fund decide to redeem their shares. To meet these redemption requests, the fund manager must raise cash quickly. In this case, if the cash balance is not enough, the manager will have to sell a portion of the fund’s holdings, even if it results in losses. This is done to honor the redemption requests without disrupting the remaining investors.

Conclusion

Here’s a quote from Warren Buffett, one of the most successful investors of all time, that emphasizes the advantage of informed individual investors over professional fund managers:

Mutual Fund Loss Booking: Our Guide to Portfolio Return Calculation

[contact-form][contact-field label=”Name” type=”name” required=”true” /][contact-field label=”Email” type=”email” required=”true” /][contact-field label=”Website” type=”url” /][contact-field label=”Message” type=”textarea” /][/contact-form]

The Power of Systematic Investment Plans (SIP) for Small Savers [A Calculator]


Let’s unlock the wealth for ourselves. There exists a universal dream among people of building wealth and securing a brighter financial future. But we often hear the cry of those who say they lack the savings required to venture into the world of investments. Hence, they procrastinate, being convinced that the doors to financial prosperity are not open to them. These people do not realize the power of systematic investment plans (SIPs). .

This article aims to give such people financial hope and empowerment. The write-up is for those who dream of building wealth even with their limited savings. There exists a financial pathway perfectly designed for this journey – Systematic Investment Plans (SIPs).

Let’s unravel the mystique surrounding SIPs. Systematic investment plans are an ally for people who can afford only small savings. Here we’ll not only grasp the essence of SIPs but also feel empowered to take our first steps.

Finance can be a daunting realm, especially for those who are new to it. Whether you’re a novice or an experienced hand, the concept of SIPs holds the promise of unlocking the doors to financial well-being for all.

So, let’s embark on this enlightening journey together, where limited savings are no longer a roadblock. We are going to make our small savings a stepping stone toward our financial freedom.


Use This Investment Planner [A Calculator]

Suppose, you are somebody, who can save only Rs.1,500 per month from your savings. But you wish that you had Rs.10 Lakhs as your wealth. Does this dream look farfetched? The way to build such wealth is to first save some money and then invest it wisely.

Use the below calculator to know how you can reach your goal. To build today’s equivalent of Rs.10 Lakhs in the next 20 years, it will need a lumpsum investment of Rs.1.17 Lakhs at a rate of return of 18% per annum.

But very few of us will have a lump-sum amount of Rs.1.17 lakhs available for investing, right? But this calculator will also tell you that a monthly SIP of just Rs.1,389 at 18% per annum for the next 20 years will build you Rs.32 Lakhs (which is today’s equivalent of Rs.10 Lakhs).

So you can see, how SIP has made it possible for a person who could only afford a savings of Rs.1,500 per month to become a Lakhpati (a millionaire).

Suggested Reading: What happens if someone gradually increases their SIP contributions each month? It further creates a snowballing effect (higher power of compounding. Check this Step-Up SIP calculator.

The Investment Planner

Result:

Future Value of the Required corpus after inflation (Rs.):

– Lumpsum Investment Required to build the final corpus (Rs.):

OR

– Monthly Investments Required to build the final corpus (Rs. per month):

Section 1: The SIP Advantage for Small Savers

Imagine a financial plan that doesn’t demand lump sum money. It is a plan where you can begin your wealth-building journey with as little as you’re comfortable with. Systematic Investment Plans, or SIPs, are precisely that. It is a strategy designed to make investing accessible to everyone, regardless of their savings potential.

At its core, SIP is about consistency and discipline. It’s like setting up a savings routine where you invest a fixed amount regularly, often monthly. The money is routed into selected mutual funds or stocks. The beauty of SIP lies in its ability to transform small, consistent contributions into a substantial corpus over time.

Distinct advantage of SIP

  1. Accessibility: Unlike traditional investments that require a lump sum upfront, SIPs can have a modest starting point. With an affordable minimum investment threshold, SIPs are the gateway to financial growth for individuals who thought they needed more money to start.
  2. Discipline: SIP instills financial discipline. When we commit to investing a fixed amount regularly, it becomes a financial habit. This disciplined approach ensures that our money is being put to work automatically month after month.
  3. Risk Mitigation: We worry about market volatility. SIPs address this concern through a concept known as “rupee cost averaging.” This means you buy more units when prices are low and fewer when prices are high. Over time, this strategy lowers our average cost per unit, helping you navigate market ups and downs. In fact, the greater will be fluctuations, the better it is for the SIP.
  4. Long-Term Growth: SIP is not a get-rich-quick scheme. It’s designed for those with a long-term investment horizon. The longer you stay invested, the more your wealth can grow. Compound interest, often referred to as the “eighth wonder of the world,” works its magic best over time, and SIP allows it to tap into its potential.

In essence, SIPs are a financial ally for small savers. Whether you’re saving for your child’s education, a dream vacation, or a comfortable retirement, SIPs provide the tools to turn your aspirations into financial reality.

Section 2: Overcoming the Lump Sum Myth

The belief that substantial savings are a prerequisite for entering the world of investments is a myth. It can discourage many aspiring investors. However, Systematic Investment Plans (SIPs) are tailor-made to beat this myth.

Imagine yourself as an athlete who does marathons. SIP investing is like running a marathon, steadily pacing yourself over time. While lump-sum investing is like sprinting. It requires a burst of funds upfront.

SIP overcoming the myth of lumpsum investing

  1. Compounding Magic: SIPs can be as effective money compounders as lump-sum money. Compounding is the process by which your investments earn returns, and those returns, in turn, generate more returns. Over time, this snowball effect can lead to significant wealth accumulation. The longer you stay invested, the more powerful compounding becomes. Compounding equally applies to all forms of investing.
  2. Smoothing Market Volatility: Market timing is a challenge for small investors. When one invests in a lump sum, bad timing can lead to losses or below-average gains. SIPs spread our investments over time, in highs and lows. Hence, in SIP investing the need to time the market becomes irrelevant. Why? Because one is investing at all times.
  3. Affordability: SIPs make investing affordable. You don’t need a vast amount of money upfront. Instead, you start with an amount that fits your budget, as small as you’re comfortable with (Rs.500 per month).

Practical Tip: Keeping an SIP in an equity scheme running at all times is the first step. In parallel, let a recurring deposit (RD) run and accumulate some cash in your bank account. Whenever there is a big correction or a crash in the market, use the funds in the RD to buy units of your SIP mutual fund in bulk. This way you are able to take the benefits of both, regular and lump-sum investing.

To illustrate the power of SIP and compounding, consider this simple example. Suppose you are a 25-year-old individual who just got into a job. Your target is to accumulate today’s equivalent of Rs.1 Crores as your retirement fund. To reach the goal, you will need to invest Rs.2,34,000 in lump-sum (at 18% per annum) for 35 years.

Now, how many 25-year-olds will have a spare Rs.2.34 lakhs for investing? A tiny minority, right? But a SIP of only Rs.2,250 at 18% per annum will build a today equivalent of Rs.1.Crore in 35 years (check the calculation in the above calculator).

Section 3: Key Benefits of SIP

Systematic Investment Plans (SIPs) are a tailored strategy designed to empower small savers. Let’s delve into the multitude of benefits of the SIP, in addition to what we’ve already seen.

  1. Accessibility: SIPs are remarkably inclusive. They break down the entry barriers to investing by allowing us to start with a minimal amount, as low as ₹500 or ₹1,000 per month. This accessibility means anybody can start investing regularly.
  2. Professional Management: Through SIPs, we invest in mutual funds. These funds are managed by experienced professional fund managers. Their expertise can be invaluable, especially for those who may not have the time or knowledge to manage their investments actively. A SIP investor just dumps his money to the fund manager who in turn applies his skill and knowledge to invest the collected money.
  3. Transparency: As SIPs are done in mutual funds, there is full transparency about where the money is invested. People can check the details of their mutual fund scheme online, anytime. The details of our contributions, the units purchased, and the current value of investments are all available online. This transparency ensures that we stay informed about our progress.


Section 4: Getting Started with SIP

Now that we’ve discovered the power of Systematic Investment Plans (SIPs) and their benefits, it’s time to take the next step. Don’t worry; it’s a straightforward process.

  1. Set Clear Financial Goals: Before diving into SIPs, it’s crucial to define the financial objectives. There are two things that must be defined, the corpus size and the time available to build that corpus.
  2. Assess Where To Invest: Experts also call it assessing one’s risk tolerance. This step is also straightforward and it is linked to our investment horizon. If the time is less than 3 years, one must invest in debt mutual funds. If the time is less than 5 years, hybrid funds are suitable. For a time horizon above 5 years, pure equity funds (or even direct stocks) are best.
  3. Choose the Right SIP: Choosing a mutual fund scheme that aligns with our goals is essential. One of the better ways to do it is to use a mutual fund screener. The Stock Engine has a mutual fund screener, it comes bundled up as free with it. Once you have picked a suitable scheme, you will know approximately what returns you can expect in the future.
  4. Determine the Investment Amount: Use the investment calculator provided in this article to determine how much you should invest each month (SIPs) to reach the goal.

Starting A SIP

All mutual funds have two plans, regular and direct. A direct plan always yields higher returns than a regular plan. Why? Because the total expense ratio of a direct plan is lower than a regular plan. Generally speaking, a direct plan will yield a 1% higher return than its regular sibling. Over a long SIP period, like 10 years, this 1% extra return can make a big difference.

For example, investing Rs.2,250 each month at 17% per annum for 35 years will build a corpus of Rs.5.91 Crore (equivalent to today’s Rs.76 Lakhs). Similarly, investing Rs.2,250 each month at 18% per annum for 35 years will build a corpus of Rs.7.89 Crore (equivalent to today’s Rs.1.0 Crore). So you can see, that a minor 1% differential in return substantially affects the final corpus.

Now the question is, how to invest in direct plans? The best way is to open the website of the mutual fund company (like ICICI Pru, HDFC Securities, Axis Mutual Funs, etc.) and apply there. You can also use apps like Kuvera to easily invest in direct plans.

Section 5: Real-Life Success Stories

Real-life stories have the power to inspire and demonstrate that wealth creation through Systematic Investment Plans (SIPs) is not only blah-blah but an achievable reality.

Let’s meet a few individuals who started with limited savings and witnessed their financial dreams come true through the magic of SIPs:

Rajesh’s Dream Vacation

Rajesh, a young professional, had always dreamt of taking his family on an exotic vacation. He decided to start a SIP for the next 3-year period in a debt mutual fund. Over the years, his SIP investments have grown consistently. As SIPs are executed on autopilot, at the end of the period Rajesh was astonished to see the accumulated corpus. Rajesh’s story is a testament to how SIPs can turn aspirations into reality, one step at a time.

Mita’s Education Fund

Mita was worried about her child’s future education expenses. With limited savings, she felt overwhelmed by the thought of covering the cost of higher education. Mita began a SIP specifically for her child’s education. As she diligently contributed for 12 years, a sum of Rs.5000 each month in a multi-cap mutual fund (16% p.a.). When the time came for her child to pursue higher studies, Mita was relieved that she had more than Rs.20 Lakhs in her SIP account.

Ankit’s Early Retirement

Ankit, in his early 30s, had always dreamt of retiring early to pursue his passions. However, he believed he needed a massive lump sum to achieve this dream. Ankit started a SIP with a portion of his monthly income (Rs.25,000) and stayed committed to his long-term goal (20 years). As his time horizon was long, he decided to risk investing in a quality small-cap mutual fund (17% p.a.). To his surprise, by the time he was in his early 50s, Ankit had amassed Rs.5.5 Crores (equivalent to today’s Rs1.7 crore). This was just enough for his early retirement.

Section 6: Overcoming Common Excuses

Excuses often stand as formidable roadblocks on the path to financial prosperity. However, understanding and addressing these common excuses can help us overcome them. For all of us who feel that investing is not easy, SIP is the answer to most of our excuses.

Excuse 1: “I’ll Start When I Earn More”

Delaying your investment journey until you earn more is a missed opportunity. By starting early, we can take advantage of the magic of compounding in the later years. Waiting until you earn more may cost you valuable years of potential wealth accumulation. So, even if one’s income is less, it is wiser to at least start a SIP of Rs.500 per month and let it compound for decades.

Excuse 2: “I Don’t Understand Investing”

Investing can seem complex, but SIPs in mutual funds can simplify the process. When we invest in SIPs, we are essentially delegating the investment decisions to the fund managers of the mutual funds. All you need to do is select a suitable mutual fund scheme that aligns with your goals and risk tolerance. It’s an excellent way for beginners to participate especially in the stock market.

Excuse 3: “I’m Afraid of Market Volatility”

Market volatility can be intimidating, but SIPs are designed to mitigate this risk. Suppose you are in your early 20s and have little idea of equity. Should you avoid equity and start your investments with insurance or bank deposits? I think a better start would be to start a SIP in index funds. To know more about index investing; read this article.

Excuse 4: “I’ll Build Emergency Savings, Then Invest”

Building emergency savings is essential. While saving is essential, delaying the start of a SIP in a suitable equity-linked plan is also a necessity. Even a 2-3 years delay can substantially hinder the possibility of us reaching our financial goals. I think, when the convenience of SIP is there, we shall not delay our equity exposure even by one month. Start today.

Conclusion

In the journey towards financial empowerment, small savers often find themselves wrestling with doubts, hesitations, and perceived limitations. However, we stand at the cusp of transformation, where small savers are no longer bound by the confines of their initial savings. Systematic Investment Plans (SIPs) emerge as the torchbearers of financial hope and empowerment.

SIPs shatter the misconception that substantial savings are a prerequisite for investing. They offer a disciplined, strategic, and long-term approach that not only mitigates risk but also leverages the power of time and compounding.

Remember that it’s not the size of your initial savings that matters but the commitment to your financial goals. SIPs are the vehicle that transforms determination into prosperity.

The power to unlock wealth and secure a brighter financial future is within your grasp.

Have a happy investing.

The Power of Systematic Investment Plans (SIP) for Small Savers [A Calculator]

[contact-form][contact-field label=”Name” type=”name” required=”true” /][contact-field label=”Email” type=”email” required=”true” /][contact-field label=”Website” type=”url” /][contact-field label=”Message” type=”textarea” /][/contact-form]

 

Penny stock hits 5% upper circuit after Promoter buys 3.85 Lakh shares; Check the details 


On Monday 25 September, shares of a real estate development company rose by almost 5% after the company’s Promoter acquired 3.85 lakh shares. Year to date, the company’s stock has gained more than 30 percent.

The shares of Swadeshi polytex were trading at Rs. 41.26 per share, up 4.99 percent from previous close price of Rs. 39.3. The company has a market capitalization of Rs. 153.27 crore. 


According to company’s exchange filings, one of the company’s Promoter, viz, ‘Paharpur Cooling Towers Limited’ has acquired 3,84,523 shares on 22nd September 2023. Pre acquisition, the above-mentioned Promoter held 16.72 percent, and post acquisition, the holding stands at 17.72 percent.

Having a walkthrough of the financials reported, the company’s revenue has increased by 22.38 percent yearly, from Rs. 36.23 crore in Q1FY23 to Rs. 44.34 crore in Q1FY24. During the same time period, the company’s net profit increased from Rs. 25.45 crore to Rs. 34.87 crore. As of march 2023, the company’s net profit margin was reported at 78.59 percent. 

According to the shareholding pattern data available for the quarter ended June 2023, the company’s Promoters hold 66.39 percent stake of the company followed by the public holding 33.54 percent of the company. 

Swadeshi polytex is engaged in the business of owning, purchasing, selling, leasing and developing real estate including land, plot, buildings, factories, warehouses, residential, commercial, agricultural and industrial infrastructures. Company also deals in immovable properties and other related assets as owners, advisors, developers, service providers and brokers.

Penny stock hits 5% upper circuit after Promoter buys 3.85 Lakh shares; Check the details


[contact-form][contact-field label=”Name” type=”name” required=”true” /][contact-field label=”Email” type=”email” required=”true” /][contact-field label=”Website” type=”url” /][contact-field label=”Message” type=”textarea” /][/contact-form]

Real Estate stock gets a buy call by brokerage for an upside of more than 20%; Do you own it? 


A “brokerage for an upside” is not a standard term in finance or investing. However, it seems you may be referring to a brokerage firm or a broker providing recommendations or advice regarding the potential for price appreciation or “upside” in a particular investment or stock. Here are some points to clarify:

  1. Brokerage Firm: A brokerage firm is a financial institution that facilitates the buying and selling of financial assets, including stocks, bonds, and other securities, on behalf of investors. Some brokerage firms employ analysts who provide research reports and recommendations to clients.
  2. Upside: “Upside” in the context of investing refers to the potential for an investment to increase in value. When a brokerage provides advice or recommendations for an “upside,” they are typically suggesting that the stock or investment has the potential for price appreciation, which would result in a profit for investors.
  3. Recommendations: Brokerage firms and analysts often issue recommendations on specific stocks or investments, such as “Buy,” “Hold,” or “Sell” recommendations. A “Buy” recommendation implies that the brokerage believes the stock has the potential for upside, meaning it could increase in value.
  4. Rationale: Brokerage firms usually provide a rationale for their recommendations. This includes analysis of the company’s financials, industry trends, competitive positioning, and other factors that influence the potential for upside.
  5. Risk Consideration: Investors should consider that even with a recommendation for upside, all investments carry some level of risk. Market conditions, economic factors, and unforeseen events can impact the performance of investments.
  6. Investor Decision: Ultimately, the decision to act on a brokerage’s recommendation is up to the individual investor. Investors should consider their own financial goals, risk tolerance, and conduct their research before making any investment decisions.
  7. Conflicts of Interest: It’s important to be aware of potential conflicts of interest when receiving recommendations from a brokerage. Some brokerages may earn commissions or fees from trading activity, which could influence their recommendations.
  8. Diversification: Many financial advisors recommend diversifying your investment portfolio to spread risk. Relying solely on one brokerage’s recommendation may not provide a well-diversified portfolio.

If you have a specific investment or stock in mind for which you’re seeking a “brokerage for an upside,” it’s advisable to reach out to a brokerage firm or a financial advisor for their analysis and recommendation. They can provide insights into the potential for price appreciation and help you make informed investment decisions.

Stock of this small cap real estate company got a buy recommendation from a well known brokerage based in India. In the past month the company’s stock has gained more than 15%. 

PNC Infratech

At 11:00 a.m, the shares of PNC Infratech Limited were trading at Rs 376, gaining around 2 percent as compared to the previous closing levels of Rs 370, with a market capitalization of 9,656 Cr. 


During the last six months, the company’s stock has paced up and gained more than 40 percent from Rs 265.10 in March 2023 to the current price levels.


ICICI Direct, one of the well-known Investment Banks , has given a ‘Buy’ tag to the company’s stock for the next 12 months with a target price of Rs 460 indicating a potential upside of 23 percent as compared to the closing stock price levels. 

The rationale behind providing such a recommendation pertains to various trigger points comprising strong order book, healthy revenue visibility, funding of their hybrid-annuity mode (HAM) projects,etc.

According to the recent financials of the company, it has reported an increase in the revenue from 7,021 Cr FY22 to 7,898.28 in FY23. Moreover, the company’s net profits have increased from 580 Cr to 658 Cr.

Due to the increase in the raw material cost, the profitability ratios of the company have slightly gone down with the return on equity (ROE) declining from 17.37 percent to 16.64 percent, and the return on capital employed (ROCE) reducing from 15.74 percent to 15.05 percent. 


According to the latest shareholding data available for the June 2023 quarter, the company’s Promoters hold a 56.07 percent stake, and the Foreign Institutional Investors (FIIs) hold a 10.26 percent stake in the company.

PNC Infratech Limited provides infrastructure implementation solutions that include engineering, procurement, and construction (“EPC”) services and it executes O&M services on a fixed-sum turnkey basis.


Real Estate stock gets a buy call by brokerage for an upside of more than 20%; Do you own it? 


A “brokerage for an upside” is not a standard term in finance or investing. However, it seems you may be referring to a brokerage firm or a broker providing recommendations or advice regarding the potential for price appreciation or “upside” in a particular investment or stock. Here are some points to clarify:

  1. Brokerage Firm: A brokerage firm is a financial institution that facilitates the buying and selling of financial assets, including stocks, bonds, and other securities, on behalf of investors. Some brokerage firms employ analysts who provide research reports and recommendations to clients.
  2. Upside: “Upside” in the context of investing refers to the potential for an investment to increase in value. When a brokerage provides advice or recommendations for an “upside,” they are typically suggesting that the stock or investment has the potential for price appreciation, which would result in a profit for investors.
  3. Recommendations: Brokerage firms and analysts often issue recommendations on specific stocks or investments, such as “Buy,” “Hold,” or “Sell” recommendations. A “Buy” recommendation implies that the brokerage believes the stock has the potential for upside, meaning it could increase in value.
  4. Rationale: Brokerage firms usually provide a rationale for their recommendations. This includes analysis of the company’s financials, industry trends, competitive positioning, and other factors that influence the potential for upside.
  5. Risk Consideration: Investors should consider that even with a recommendation for upside, all investments carry some level of risk. Market conditions, economic factors, and unforeseen events can impact the performance of investments.
  6. Investor Decision: Ultimately, the decision to act on a brokerage’s recommendation is up to the individual investor. Investors should consider their own financial goals, risk tolerance, and conduct their research before making any investment decisions.
  7. Conflicts of Interest: It’s important to be aware of potential conflicts of interest when receiving recommendations from a brokerage. Some brokerages may earn commissions or fees from trading activity, which could influence their recommendations.
  8. Diversification: Many financial advisors recommend diversifying your investment portfolio to spread risk. Relying solely on one brokerage’s recommendation may not provide a well-diversified portfolio.

If you have a specific investment or stock in mind for which you’re seeking a “brokerage for an upside,” it’s advisable to reach out to a brokerage firm or a financial advisor for their analysis and recommendation. They can provide insights into the potential for price appreciation and help you make informed investment decisions.

[contact-form][contact-field label=”Name” type=”name” required=”true” /][contact-field label=”Email” type=”email” required=”true” /][contact-field label=”Website” type=”url” /][contact-field label=”Message” type=”textarea” /][/contact-form]