In the dynamic world of finance, few market conditions hold the allure and potential for substantial gains quite like a bull market. For investors, it represents a time of optimism and opportunity, where the sun seems to shine brighter on their portfolios. But what exactly is a bull market, and why is it such a pivotal period for those seeking to grow their wealth?
The benefits of investing in a bull market can be vast, but so are the risks. People who invest in the bull market in an uninformed and undisciplined way are at high risk. Hence, it is better to first learn how to profit from the bull market.
In a bull market, long-term investors especially face a challenge that can hinder their ability to profit optimally. How?
Firstly: The allure of short-term gains may tempt them to deviate from their well-thought-out investment plans, leading to impulsive decisions.
Secondly: The rising market euphoria might cause overconfidence, leading to potential overexposure to high-risk assets. For example, buying a good stock but at its peak.
Thirdly: Moreover, identifying fundamentally strong stocks amidst the market’s exuberance becomes challenging as even weaker companies may experience temporary upticks.
Lastly: The fear of missing out (FOMO) on rapid price appreciation may prompt investors to chase speculative “hot” stocks. It can expose them to higher volatility and potential losses.
The first step to profit from the bull market is to identify stocks with the potential to outperform the broader market. Several strategies can assist you in this endeavor:
Fundamental Analysis: How to profit from the bull market begins with a deep dive into a company’s fundamentals. Analyze financial statements, earnings growth, and revenue trends to assess the company’s health and growth prospects. Look for companies with solid financials, strong management teams, and competitive advantages in their industries.
Sector Analysis: Different sectors perform differently during a bull market. Some sectors, like technology and healthcare, tend to excel, while others may lag. Stay informed about sector-specific trends and choose stocks from sectors poised for growth.
While a bull market can create an aura of invincibility, it’s essential to avoid becoming overconfident and putting all your eggs in one basket. Diversification is a powerful risk management tool that involves spreading your investments across various asset classes, industries, and regions. By diversifying, you can potentially reduce the impact of any single stock’s poor performance on your overall portfolio.
Additionally, when we talk about diversification, we must remember that spreading our money among various non-related stocks is not enough. To have a well-diversified portfolio, one must include different asset classes. For example, a combination of stocks, debt funds, REITS, gold ETFs, and bank deposits can give better diversification.
Timing is critical when it comes to profiting from a bull market. Technical analysis can help you make informed decisions based on market trends and price patterns. Here are some techniques to consider:
Trend Analysis: Identify the primary trend of the market and individual stocks. Buy when the trend is upward and consider selling or taking profits when the trend shows signs of reversing.
Support and Resistance Levels: Look for support levels, where prices historically find stability during declines, and resistance levels, where prices tend to stall during rallies. These levels can provide valuable insights for entry and exit points.
Moving Averages: Use moving averages to track the average price of a stock over a specific period. The crossover of short-term and long-term moving averages can signal potential buying or selling opportunities.
Most long-term investors completely ignore technical analysis. I also do not use it for my stock analysis. But when the market is bullish, a slight exposure to technical analysis will not hurt. The bigger idea is to avoid catching a knife that is just about to start falling.
The euphoria of a bull market can lead to emotional decision-making, which can be detrimental to your investment success. Here’s how to profit from the bull market by managing emotions:
Stick to Your Plan: Have a well-defined investment plan and stick to it, regardless of short-term market fluctuations. Avoid making impulsive decisions based on fear or greed.
Avoid Chasing “Hot” Stocks: FOMO (Fear of Missing Out) can lead you to invest in high-flying stocks at their peaks. Be cautious of such irrational exuberance and conduct thorough research before investing.
Meet Priya, a seasoned investor with an unwavering passion for the stock market. Over the years, she had navigated through various market cycles, but the bull market of 2021 presented a unique opportunity for her to put her skills and knowledge to the ultimate test.
As the Indian stock market surged to new heights, Priya was determined to capitalize on the market’s optimism while staying true to her long-term investment philosophy. Armed with a well-diversified portfolio, she carefully selected promising stocks from sectors poised for growth. Her extensive fundamental analysis led her to invest in companies with strong financials, innovative products, and robust management teams.
Priya’s steadfast commitment to her investment plan was her greatest asset during the bull market. Amidst market euphoria and tantalizing gains, she remained disciplined. She refrained from impulsive trading and short-term speculations. Instead, she focused on holding her carefully selected stocks, aiming to benefit from their growth potential over the long run.
While a buy-and-hold investor at heart, Priya also appreciated the value of technical analysis as a supplementary tool. She used trend analysis and support and resistance levels to time some of her stock purchases. She added some stocks to her positions during temporary pullbacks.
Priya’s diversified approach shielded her from potential pitfalls in the bull market. While she enjoyed significant gains from her tech stocks, she also maintained a balanced portfolio with exposure to defensive sectors.
Moreover, she also made a point to balance her portfolio by simultaneously investing in fixed deposits. Suppose she had Rs.10,000 available for investing. Of the available money, she invested 70% in the market and the balance she kept in the bank FD.
As the bull market surged forward, Priya encountered moments of volatility that tested her emotional resilience. Market corrections and temporary pullbacks challenged her commitment. But she remained undeterred by focusing on her long-term goals and keeping her emotions in check.
She also used the current bull run to sell off a few stocks that got included in her portfolio by mistake. She did it anyways even though she had to book losses. Why? Because a bull market is the best time to offload fundamentally weak stocks.
As the bull market reached new heights, Priya’s well-crafted strategies bore fruit. Her portfolio not only outperformed the broader market but also delivered consistent returns. By the end of the bull market, Priya had not only capitalized on the favorable market conditions but also honed her skills as a prudent and confident investor.
This case study exemplifies how one can profit from the bull market. Her disciplined approach and carefully crafted strategy served as the cornerstones of her success.
There are a few things that become clear after reading this article. Success in a dynamic market depends not merely on the market’s momentum but on the investor’s ability to make prudent decisions.
By identifying promising stocks through thorough fundamental and sector analysis, investors can lay a strong foundation. These steps will not only fetch growth but will also weather market fluctuations. Diversification emerges as a powerful shield against market volatility, safeguarding portfolios from undue exposure to individual stock risks.
Technical analysis, becomes a guiding compass, empowering investors to make informed decisions based on market trends and price patterns. Timing the market is a skill that can enhance returns. But it should never overshadow the importance of staying invested for the long term.
Perhaps the greatest challenge for long-term investors in a bull market is managing emotions. Staying disciplined, adhering to a well-defined investment plan, and focusing on long-term objectives is vital. By avoiding the traps of overconfidence and FOMO, investors can steer clear of impulsive decisions that may jeopardize their financial goals.
Profiting from a bull market requires careful planning, discipline, and a solid understanding of investment strategies. A bull market is characterized by rising stock prices and generally positive investor sentiment. Here are some strategies to consider when seeking to profit from a bull market:
Diversification involves spreading your investments across various asset classes (stocks, bonds, real estate, etc.) and industries. This can help reduce risk in case of a market downturn.
Look for fundamentally strong companies with a track record of profitability, solid financials, and competitive advantages. These companies are more likely to perform well in a bull market.
Consider a long-term investment horizon. Bull markets can last several years, so avoid trying to time the market and instead focus on your investment goals over the long run.
Invest a fixed amount of money at regular intervals, regardless of market conditions. This strategy can help you avoid making emotional decisions and allows you to buy more shares when prices are low and fewer when prices are high.
While it’s tempting to go all-in during a bull market, it’s crucial to maintain a balanced risk profile. Avoid overexposure to high-risk assets and maintain a diversified portfolio.
Define your financial goals, such as retirement, buying a home, or funding education. Having clear objectives will help you make informed investment decisions.
Continuously monitor financial news and market trends. Staying informed can help you adjust your strategy as needed to adapt to changing market conditions.
Be cautious of investing in stocks or assets solely based on market hype and speculation. FOMO (Fear of Missing Out) can lead to irrational investment decisions.
Consider periodically rebalancing your portfolio by selling some of your holdings that have appreciated significantly. This can help you lock in profits and maintain your desired asset allocation.
If you’re unsure about your investment strategy or lack the time and expertise, consider consulting with a financial advisor who can provide personalized guidance.
While a bull market generally means rising prices, there will still be periods of volatility. Be mentally prepared for market fluctuations and avoid making impulsive decisions.
Remember that past performance is not indicative of future results, and there are no guarantees in the stock market. It’s essential to have a well-thought-out investment strategy and to remain disciplined throughout the bull market. Additionally, consider your risk tolerance and financial situation when making investment decisions.
Investing in stocks is a long-term strategy. The stock market can be volatile in the short term, but over the long term, it has historically trended upwards. This means that if you invest in stocks and hold them for a long period of time, you are likely to see your money grow.
Use this calculator to estimate how much of your net savings you can invest in stocks. The calculator will estimate your stock investing capacitybased on your investment horizon, risk profile, age, and net savings capacity.
By investing in stocks and knowing how much money you can afford to invest each month, you can grow your wealth over the long term and reach your financial goals. There are a few factors you should consider when determining how much to invest in stocks.
How much money do you have coming in each month? What are your total expenses (just include everything here)? Subtract expenses from your income to know your disposable income. Now, start to think about how much of that you can afford to invest. You can get a clue from your age.
It means that a younger person can invest a higher portion of his savings in stocks as compared to an older person. For example, a person who is 70 years of age can invest about 30% of his net savings in stocks.
But age is not the only factor that determines how much money one can invest in stocks. Let’s see factor number two.
So considering one’s stock investing experience and psychological setup, all investors can be broadly categorized into four types:
Defensive: People falling under this category should not invest more than 25% of their net savings in stocks.
Moderately Defensive: People falling under this category should not invest more than 50% of their net savings in stocks.
Moderately Aggressive: People falling under this category can invest up to 75% of their net savings in stocks.
Aggressive: People falling under this category can invest up to 100% of their net savings in stocks.
Please note that the age factor shall not be ignored in deciding how much money one can invest in stocks. A combination of the age factor and one’s risk tolerance will give a more apt answer.
Time horizon can play a very essential role in stock investing. The longer one can stay invested in stocks, the lower will be the risk of loss and the higher will be the chances of fast compounding.
One can use the above online calculator to decide how much money one can invest in stocks. But stock investing is not only about putting money to work. Knowing how much to invest is just a starting point. One must also learn other important basics of stock investing:
Here are some tips one can utilize to start investing in stocks wisely:
When you are first starting out investing in stocks, it is important to start small. This will allow you to learn the ropes and get a feel for how the market works without risking too much money.
There are a few reasons why it is important to start small.
Second, when you are first starting out, you may not have a lot of money to invest. Starting small will allow you to invest what you can afford. One can gradually increase the investment amount over time.
Third, starting small will give you time to learn to analyze different types of stocks. Picking the right ones that suit one’s investment goal is the key.
There are a few ways to start small when investing in stocks. One way is to invest in stocks through exchange-traded funds (ETFs). ETFs can be bought and sold just like stocks from the stock market. But ETF is a collection of companies grouped into one security which is called ETF. Beginners can trade in Index ETFs to get a feel of stock investing. As Index ETFs represent a basket of quality companies, the risk of loss is greatly minimized.
Another way to start small is to invest only 50% of your calculated value (as per the calculator), in direct stocks. The balance shall be invested in Index ETFs. While investing in direct stocks, make sure to buy stocks of only blue chip companies.
Diversification is one of the most important principles of investing. It means spreading your money across different assets, such as stocks, gold, debt, cash, and REITs. This helps to reduce your risk because if one asset class performs poorly, your other assets may help to offset the losses.
First, it helps to reduce your risk. If you put all of your money in one stock, and that stock goes down, you could lose a lot of money. However, if you spread your money across different stocks, you are less likely to lose as much money if one stock goes down.
Second, diversification may also help you to improve your returns. For example, if one invests only in blue chip stocks, the long-term returns are stable but not as high. If one diversifies one’s stock portfolio between blue chips and quality low-cap stocks, the long-term return potential can greatly improve.
There are a few different ways to diversify your portfolio. One way is to invest in different stocks. Another way to diversify your portfolio is to invest in different asset classes. For example, you could invest in stocks, REITs, Gold ETFs, physical gold, real estate properties, debt funds, bank deposits, etc.
Doing your research is one of the most important things you can do before investing in any stock. This means understanding the company’s business model, its financials, and its competitive landscape. You should also be aware of the risks associated with investing in the company.
There are a few different ways to do your research. The most reliable method is to do a thorough fundamental analysis of the company. Once you have done your research, you should have a good understanding of the company and its prospects. This will help you make an informed decision about whether or not to invest in the company.
Beginners may not find it easy to do a complete fundamental analysis. In such a case they may use our Stock Engine to get the analysis done upon click of a button. Alternatively, they can also follow a relative price valuation method to get the analysis done.
The stock market is volatile, and there will be times when the market takes a downturn. This is normal, and it is important to remember that the market has historically trended upward over the long term.
There are a few reasons why it is important to be patient when investing in stocks.
First, the stock market is cyclical. This means that there will be periods of growth and periods of decline. If you sell your stocks when the market takes a downturn, you will miss out on the potential for growth in the future.
Third, the stock market is unpredictable. This means that you cannot predict when the market will take a downturn. If you try to time the market, you are likely to make mistakes.
By being patient, you can avoid selling your stocks at a loss and give your money time to grow. This is an important part of investing in stocks for the long term. A lot of money can be made out of quality stocks just by staying invested in them for a very long term (like 7-10 years).
Investing in stocks can be a great way to grow your wealth over the long term. However, it is important to know how much money you should invest each month. Hence, I have also provided an online calculator that people can use to help determine how much money can be invested in stocks The calculators typically take into account the net saving potential, age, and risk profile of the investor.
Once you know how much you can afford to invest, you can start to think about how to invest your money.
Modern property developers, in partnership with banks, provide a unique home loan feature where EMIs commence post-property possession. This deferred payment structure grants buyers financial flexibility. This arrangement aligns with buyers’ convenience and reduces the initial financial burden of EMI payment in addition to rent payment. But is this deferred home loan EMI offer is too good to be true, or is there a hidden catch that we cannot see?
One of my friends bought a nice 3 BHK residential property. His builder offered the option of easy EMIs where the loan EMIs will start only post-possession of the property. My friend liked this alternative and went with it.
Is it not fantastic? But my friend always had this itch in mind that how the bank is offering such a facility. The bank is surely losing on EMIs (interest) in the initial years (till possession). So, how they are making up for this loss?
When my friend approached me with this query, the first thing I did was code a simple calculator. While coding this calculator, the answers became more visible.
In this article, I’ll share the calculator with you. Moreover, I’ll also share my views about deferred EMI options. I hope you will get some additional perspective on home loan EMIs from this article.
P. Note: The calculator assumes that 100% of the home loan amount gets disbursed on the date of the first disbursement itself. I’ve assumed this to keep the calculation simple and understandable. I know this is a limitation, but still, the calculator will bring forth the point that this article is trying to emphasize.
How to use this calculator? As with other EMI calculators, just enter the loan amount, interest rate, and loan tenure. Then it will ask for one more detail which is the possession period in years. It is the period between the loan disbursal start and the date of possession. For reputed builders in India, on average, this period is approximately 3 years. But it can be higher for other builders.
Pre-EMI: Start paying the Pre-EMI (only interest) from the date of disbursement. The Pre-EMI will continue till possession. After getting possession, the borrower will have to start paying the Full-EMI.
Full-EMI (From Beginning): In this case, start paying the Full-EMI, principal plus interest, from the date of start of the loan disbursement itself.
Full-EMI (After Possession): The third alternative is, Full-EMI payment will start only after the possession of the house is received.
Use the above calculator to know the difference between the EMIs and total loan repayment made for each of the above three cases.
Real Estate Investors: Investors who buy properties for rental income or short-term appreciation often prefer Pre-EMIs. This option allows them to reduce initial cash outflows, enabling them to allocate funds to other investments or properties. This way they only pay the loan interest. By the time it becomes necessary to start paying the principal, they sell and book profits. The sales proceeds are used to pre-pay the home loan in full.
People who are living in a rented home and have taken a home loan can also opt for this option. Paying the rent and the full loan EMIs may be hard on the pocket. Hence, Pre-EMIs are one way to manage expenses.
But I personally think that one must choose a property that complements their cash flow at that moment in time. Buying an affordable property that will help us pay both the EMIs and rents is a wiser choice to make. But I know, when it comes to owning a house, people mostly overspend way beyond their means. Try using this home affordability calculator to know more about your affordability.
For Whom Saving is a Priority: People whose priority is to save much as possible on home loan interest will pay the EMIs in full from day one. This way they are not only paying the interest portion of the loan but are also reducing the loan outstanding balance. This way over time, they save considerably on interest payments.
Such people also try to pre-pay their home loans thereby saving more on interest payments. For me, this is the ideal option to choose. But yes, if people are buying homes that are beyond their affordability, they will have no alternative but to go for option #1 (Pre-EMIs) or even worse
First-Time Homebuyerscan choose this option. I’m talking about people who are in their mid-twenties, just out of college, and in their first job. If they are opting to buy an affordable house for self-possession, they can choose this EMI option.
If others are choosing it, or are forced to choose it, it is a clear sign that they are overspending on their home purchase. Either they can look elsewhere, or they would have to plan aggressively for home loan pre-payments (reduce EMI or reduce the tenure).
When considering the three EMI options (1) Pre-EMIs, (2) Full-EMIs (from disbursal), (3) and Full-EMIs (possession). it’s essential to understand their potential tax implications.
The choice of EMI structure can impact a person’s personal finances and tax obligations in distinct ways.
Pre-EMIs (Only Interest payment starts from disbursal): This option reduces immediate financial burden. But the borrower may not avail of tax benefits until possession. Under Section 24 of the Income Tax Act, interest payments are eligible for tax deductions. But this benefit can be availed only when the property is ready for possession.
Full-EMIs starting from disbursal: Opting for full EMIs from the start can provide immediate tax benefits but only under Section 80C principal repayments (max 1.5 lakhs). The benefit of deductions under section 24 will start only after the property is ready for possession.
Full-EMIs starting after possession:Opting for full EMIs (after possession) from the start can provide immediate tax benefits. Under Section 24 (max 2.0 lakhs) and Section 80C, both principal repayments and interest payments are eligible for deductions. This can potentially lead to higher tax savings during the initial years of the loan tenure.
Please Note: Income tax deductions for home loans (under section 24) are accessible exclusively upon acquiring property possession. Interest payments made before possession can be claimed within the following 5 years. The interest accrued prior to possession accumulates. We can claim a tax exemption for this interest. The amount can be retrieved in five installments after the construction reaches completion.
We’ve explored the three distinct EMI options – Pre-EMIs, Full EMIs from disbursal, and Full EMIs after possession. These three EMI options give flexibility tailored to diverse borrower profiles.
But which EMI option is financially wise? To answer this question, we’ll have to touch base on the factor of affordability. People who purchase houses much within their affordability limits can start paying full EMIs from the date of loan disbursement.
People who overspend on their home purchase look for other available alternatives. What are the other alternatives? Pre-EMI, where only the interest is paid till possession. After possession, the full EMI starts. Full-EMI, where no EMIs are paid till possession. All accrued interest (till possession) gets accumulated and is added up to the original loan amount (original borrowed money). After possession, the borrower has to pay the EMIs on the total loan outstanding, that is the principal plus the accumulated accrued interest till possession. Use this loan calculator for more clarity.
Deferring EMIs on home loans, also known as “EMI holiday” or “start paying EMIs only after possession,” can be an appealing option for homebuyers under certain circumstances. However, whether it is a wise decision depends on your individual financial situation, goals, and the terms offered by the lender. Here are some factors to consider:
Cash Flow Management: Deferred EMIs can provide temporary relief to your cash flow, especially if you have other financial commitments or if you’re purchasing an under-construction property where possession is not immediate.
Room for Savings: During the deferred period, you can redirect the money you would have spent on EMIs towards other investments or financial goals, potentially earning returns or saving on interest.
Income Growth: If you expect your income to increase significantly by the time you start paying EMIs, deferring can be beneficial as your EMI burden may be easier to manage in the future.
Interest Accrual: While you’re not paying EMIs, the interest on your home loan continues to accrue. This means you’ll end up paying more interest over the loan tenure, increasing the overall cost of your home.
Loan Tenure: Deferring EMIs may extend your loan tenure, which can result in a longer-term financial commitment.
Budgeting: Ensure you use the deferral period wisely. It’s essential to have a plan for how you will use the funds that would have gone toward EMIs, such as investing or saving.
Lender’s Terms: The terms and conditions of EMI deferral can vary among lenders. Be sure to understand the specific terms, including when and how the deferred EMIs will be recalculated and added to your loan balance.
Financial Stability: Consider your job security and financial stability. It’s wise to have a backup plan in case your financial situation changes unexpectedly.
Tax Implications:Check if you can still avail of tax benefits on the principal and interest payments during the deferred period. In some cases, the tax benefits may be available only when you start paying EMIs.
If you have ample financial resources and can comfortably manage the EMIs from the beginning without straining your budget.
If you’re concerned about the increased interest cost due to the deferred EMIs and want to minimize the total loan amount.
In conclusion, deferring EMIs on a home loan can be a strategic move when used wisely and with a clear financial plan. It’s essential to carefully evaluate your financial situation, the terms offered by the lender, and the long-term implications before making a decision. Consulting with a financial advisor or home loan specialist can also help you make an informed choice that aligns with your financial goals.
Curious if your spare savings cantransform fortunes? Get set to unveil the secret of the best compounding assets. From stocks to real estate, we reveal how small steps pave the way to wealth. And that’s not all! Embark on a journey bursting with surprises, opportunities, and the gateway to realizing your financial aspirations.
We’re diving deep into this world, where even small bucks can snowball into a fortune. Buckle up as we guide you through some fast-compounding assets that can turbocharge our wealth journey. It’s time to turn our financial game from good to gold.
Compounding? It’s like turning your money into a money-making machine. Seriously, it’s the eighth wonder of the world, they say! Here’s the deal: you stash your earnings back into the investment pot – profits, interest, all that good stuff – and watch it grow. Not just on your original corpus, but also on the extra cash that we’ve racked up over time. This creates a snowball effect. It’s like hitting the financial jackpot. This is what is called compounding.
Now that we’ve spilled the beans on compounding’s superpowers, cab we take it further? Let’s ride through some top-notch compounding assets that are like tailor-made suits for the Indian crowd.
Picture this: a lineup of cool options, each with its own perks and a golden ticket to build that long-term wealth we all dream about.
So, let’s get ready to explore these financial gems that are totally our cup of chai!
For those willing to navigate the dynamic terrain of the stock market, direct stock investing stands as a compelling avenue for compounding wealth.
Investing in individual stocks offers the potential for significant long-term returns. Historically, the Indian stock market has delivered impressive returns over extended periods, making it an attractive option for wealth accumulation through compounding.
Investing in stocks requires careful consideration and research. By selecting fundamentally strong companies with a track record of consistent growth, you can harness the power of compounding to your advantage.
In India, the journey to financial success often begins with the tried-and-true Public Provident Fund (PPF). This government-backed scheme provides a safe haven for compounding wealth, offering both stability and tax benefits.
While PPF may not offer the high returns of other investment options, its reliability and accessibility make it an ideal starting point for building a strong foundation.
Imagine contributing ₹1,00,000 annually to a PPF account with an interest rate of 7.1% (as of August 2023). Over a span of 20 years, your investment could potentially grow to around ₹3,94,200.
While PPF serves as a conservative approach to compounding, its tax-free status and guaranteed returns provide a comforting sense of financial security.
It is suitable for those who are willing to embrace the dynamic nature of the stock market but are not comfortable with direct stock investing. Equity mutual funds present a compelling avenue for compounding wealth. Investing in mutual funds allows us to pool our resources with other investors. This way we can diversify risks and gain exposure to a variety of stocks.
Diving into the stock market requires careful consideration and research. By selecting well-managed equity mutual funds with a proven track record, we can harness the power of compounding to your advantage.
Real estate investments have proven to be a reliable avenue for long-term wealth accumulation. Owning property, particularly residential or commercial real estate, can yield consistent and decent rental income and capital appreciation over time.
Let’s also assume that 75% of the rental income is reinvested for 12% returns (say in an index mutual fund). The balance of 25% is utilized for its maintenance and upkeep.
By leveraging the power of compounding through rental income, value appreciation, and reinvestment, real estate investments can offer a compelling path to financial success.
Systematic Investment Plans (SIPs) in equity mutual funds have gained popularity as a disciplined and convenient approach to compounding wealth in India. SIPs allow investors to contribute a fixed amount at regular intervals. It enables us to benefit from rupee-cost averaging and the power of compounding.
In a 20 years period, this SIP investment could potentially grow to around ₹1.26 Crores.
SIPs provide the advantage of investing small amounts over time. It reduces the impact of market volatility and facilitates long-term wealth accumulation.
In India, fixed deposits remain a preferred choice for risk-averse investors seeking stable returns. While FDs may not offer the high growth potential of equities, they provide a secure way to compound wealth.
Imagine investing ₹2,00,000 in a fixed deposit with an interest rate of 6.9% per annum. Over a period of 10 years, our investment could potentially grow to around ₹3.89 Lakhs.
While FDs are conservative, they offer the advantage of capital preservation and a fixed income stream. This is what makes them a reliable option for compounding over time.
As the journey of life progresses, planning for retirement becomes a paramount consideration. The National Pension System (NPS) offers a tax-efficient and disciplined approach to building wealth for retirement.
By contributing ₹8,333 per month to an NPS account with an average annual return of 10%, let’s check what will be its compounding effect. Investing like this, our retirement corpus could potentially grow to around ₹1.9 Crore over a period of 30 years.
NPS not only offers the benefits of compounding but also ensures a secure financial future in your golden years.
We’ve also discussed the discipline of SIPs, the security of FDs, and the foresight of NPS, they are all great wealth compounders in their own way.
As you navigate the labyrinth of financial decisions, remember that compounding is more than just a strategy. It is a mindset that embraces patience, discipline, and a long-term perspective.
So let’s take the first step, and embrace the power of compounding.
Let’s dive into the mind of Howard Marks to decipher the flows of investment cycles. Who is Howard Marks? He is an American investor, writer, and co-founder of Oaktree Capital Management. We will know about what Howard Marks describes as the underlying themes that shape market movements. It will give us insights and build our strategy to navigate between market optimism, risks, and capital availability.
In this article, we’ll try to understand the rhythm of investment cycles. Markets sway between optimism and caution. This is what we called as volatility and is driven by human emotions. Understanding these patterns can help to predict the market’s highs and lows.
We can learn from history and can craft strategies for ourselves to handle market volatility. We can use the concept of market timing and disciplined decisions.
Investing is like a wave with ups and downs. Howard Marks shows us the steps of how to comprehend and manage the ups and downs of the market. In this article, we’ll uncover why understanding these steps matters. Howard Marks, a finance expert, has studied these moves for fifty years. He says that these cycles aren’t just a fancy concept; they’re vital tools for smart investors.
First, let’s grasp the importance of these cycles. We’ll see patterns in how markets move, like stars in the sky. Then, we’ll reveal the secrets behind successful moments in markets, called bull markets. A Bull Run is like a powerful music piece that makes markets rise and dance to its tune.
There will be more. We’ll dive into the investor’s sentiments. We’ll know why people act differently when markets are high or low. It’s like changing our mood when we listen to happy or sad music. And as we continue, we’ll keep unveiling the secrets of the market movements (the investment cycles).
Stay with us as we journey through the fascinating world of investing.
Imagine the world of investing like a thrilling performance. Bull markets are like the exciting high points, where three strong forces work together: euphoria, risk tolerance, and available money.
Let’s break them down:
Euphoria: Positive feelings among the investors (FIIs, DIIs, and Retail Investors) make markets go up. The top management of companies observes closely the market euphoria as it also a reflection of current demand. When the demand goes up, companies are likely to see growth and also drive economic expansion.
Risk Tolerance: People swing between being very careful and very brave. When markets are high, people feel brave and take more risks. As during a bull market, the general trend is upward, it’s easier for a majority to guess the upcycle. This clarity increases the risk tolerance of even small retail investors. It eventually results in audacious decision-making that fuels the upward trajectory of asset prices.
Surplus Money: When there’s lots of money, people get excited and want to invest. This rush of money can make markets soar. With ample capital at one’s disposal, investors rush to the market to make it grow further. This ignites a frenzy of demand and propels markets to new heights.
By understanding these three things, we start to unlock the secrets of bull markets. As we keep going, we’ll learn even more, about the investment cycles.
Think of investing like a rollercoaster ride. Sometimes, we reach high points (peaks) and sometimes we dip down (valleys). These moments are like our feelings – when we’re excited, the market goes up, and when we’re unsure, it goes down. Let’s dive into these emotional moments to understand how they affect our investing journey.
Imagine being on a mountain’s highest point or in a deep valley – that’s how markets feel. People’s thoughts (psychology) become super important. Human emotions influence investment decisions.
Peaks (Highs): When the market is high, we can get too excited and make carefree choices. It’s like getting carried away by a fun game and forgetting to be careful. This can lead to making choices we might regret later.
Valleys (Bottoms): the market bottoms are characterized by despondency and fear. Our fear of losses can overshadow logical reasoning. It can prompt investors to become too risk-averse. It is within these moments of despair that golden opportunities beckon. During these times, stock prices plummet to levels below their intrinsic value.
So you can see, general human emotions make uscautiousin a bear market and exploring in a bull market. But as a good practice, we should do the opposite.
One must keep caution as a crucial companion when markets are high (bull). It will remind us to tread carefully amidst the intoxicating atmosphere of optimism. It is during these times that the allure of profit must be tempered by a measured assessment of risk. Conversely, the depths of market valleys (bulls) offer a chance to seize undervalued stocks.
There is a profound truth in Mark Twain’s timeless wisdom: “History doesn’t repeat, but it rhymes.” It means that while events might not happen exactly the same way again, there are similarities and patterns that we can recognize. In the context of investing, it suggests that while markets and situations may not play out exactly as they did before, we’ll experience recurring themes. We can learn from the past and use it to anticipate future trends.
There have been past cycles that bear striking resemblances to their future happenings. By recognizing these rhymes, we gain a unique vantage point. We can use this position of advantage to anticipate and interpret the future movements of the market.
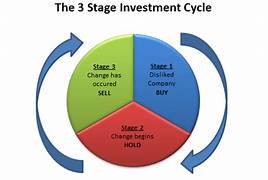
Basically, there are two major themes we must keep in mind, crash/corrections (leading to market bottom), and recovery (leading to peaks).
In the late 1990s, there was a global technology boom. We remember it as the “dot-com bubble.” The Indian stock market also experienced a surge in technology-related stocks during this period. Many investors were driven by optimism and invested heavily in technology companies. It eventually lead to soaring stock prices.
However, by the early 2000s, the bubble burst, and stock prices plummeted as investors realized that many of these companies were overvalued.
Fast forward to more recent times (2020 and 2021), we’ve witnessed a similar surge in technology-related stocks, driven by the growth of digital services and e-commerce in India. But from 2022 onwards, we are seeing a slump in the same stocks.
While the specific companies and technologies involved are different, the underlying theme of investor enthusiasm and subsequent correction is a rhyme with the dot-com bubble.
The Indian stock market has faced various corrections over the years due to factors like economic slowdowns, geopolitical tensions, and global financial crises. Each correction is unique in its causes and circumstances. However, what tends to rhyme is the cycle of fear and panic among investors during a downturn, followed by a gradual recovery as markets stabilize and confidence returns.
For instance, during the global financial crisis of 2008, Indian stock markets experienced a significant decline. Similarly, during the COVID-19 pandemic in 2020, the market faced a sharp drop. In both cases, the initial fear and uncertainty led to market sell-offs. However, over time, as economic conditions improved and measures were taken to address the issues, the markets eventually recovered.
These examples showcase how historical events in the Indian stock market may not repeat exactly, but they exhibit similar patterns and behaviors. By recognizing these rhymes, we can gain insights into market dynamics and potentially make more informed decisions.
Trained investors can predict the twists and turns of the market. But to do it, one must first learn to comprehend the underlying patterns. Once the pattern becomes obvious, strategies can be built to take advantage of it.
A combination of these three indicators: optimism, risk tolerance, and capital availability shape a bull market and vice versa. If one can learn to watch the balance between these three indicators, market movements can be forecasted. This should be the basic strategy that allows us to be prepared for what is coming next.
However, what is even more important is a sound understanding of human psychology. Our emotions play a key role in our investment decisions. The way we perceive opportunity and threat shapes our actions. The thing that we called rationality can be completely wrong if we wrongly interpret the conditions.
For example, the bull market is a time to be cautious. But what majority do during such times? They invest heavily during this time. Similarly, when the market is bearing and nearing its bottom, it is a time to be most enthusiastic. But in the doom and the gloom of the market, we behave otherwise.
We must learn to channel our emotions. To do it we must first train ourselves to read what is an opportunity and what is a threat. If we can do it, we can ride the tides of the investment cycles like a pro.
Our adventure has shown us the steps of investment cycles, from the exciting bull markets to the low points. Think of optimism, caution, and available money as bright stars, showing us the way to success.
History is like an old friend, giving us hints about what might happen next. We can build an understanding to decipher the rhythm of market ups and downs. The majority of people behave irrationally during the market’s highs and lows. Hence, if we build correct rationales, we can take advantage of the market cycles.
The idea is to correctly match our investment cycles with the market cycles.
We must be ready to write our investment story with wisdom and strategy, dancing to the rhythm of investment cycles.
Instant credits after every purchase on a credit card is not a standard feature offered by credit card issuers. However, some financial technology companies and credit card providers have introduced similar concepts or features, such as “cashback” or “reward points” programs that provide benefits for using their credit cards. Here’s how these programs typically work:
Cashback Rewards: Many credit cards offer cashback rewards, which allow cardholders to earn a percentage of their purchases back as a statement credit or a direct deposit into their bank account. For example, a credit card might offer 1% cashback on all purchases. So, if you make a $100 purchase, you would earn $1 in cashback rewards.
Reward Points: Some credit cards offer reward points for each purchase made. These points can be accumulated and redeemed for various rewards, such as gift cards, merchandise, travel, or even statement credits. The number of points earned per dollar spent varies depending on the card’s rewards program.
Instant Rewards: While instant credits after every purchase are not common, some credit card providers have introduced features that allow cardholders to redeem rewards or cashback in real-time, such as applying cashback to the current transaction or using reward points to offset a purchase.
It’s essential to understand that the specific rewards and benefits associated with a credit card can vary widely from one card to another. When considering a credit card with rewards or cashback features, here are some important factors to keep in mind:
Interest Rates: Consider the interest rates associated with the credit card, as high-interest charges can quickly offset any rewards or cashback earned if you carry a balance.
Annual Fees: Some rewards credit cards may have annual fees. Evaluate whether the potential rewards outweigh the cost of the annual fee.
Redemption Options: Understand how you can redeem the rewards or cashback earned. Some cards offer flexibility in how you can use your rewards, while others may have more limited options.
Reward Caps or Limits: Some cards may have limits on how much you can earn in rewards or cashback within a specific timeframe.
Credit Score: Qualifying for a rewards credit card may require a good to excellent credit score. Be sure to check the credit score requirements before applying.
Terms and Conditions: Read the credit card’s terms and conditions carefully to understand the details of the rewards program, including any exclusions or restrictions.
In summary, while instant credits after every purchase are not a standard credit card feature, you can explore credit cards with cashback or rewards programs that provide benefits for using the card. It’s important to choose a card that aligns with your spending habits and financial goals, and to manage your credit card responsibly to avoid accumulating debt.
The significance of credit card management in our financial journey cannot be ignored. Recently I received a query from of my readers about a peculiar way of credit card bill payment method. He wanted to know if this method will help him to further improve his credit score. The article is about this query and other similar queries on credit card management.
The reader asked about crediting the credit card account immediately after making any purchase. This query was both insightful and relevant. Hence, I thought to share the discussion as a blog for everyone.
In this FAQ-style blog, we’ll delve into the nuances of this practice and its potential impact on your credit card management and credit score.
A person in his early 20s who hasn’t gotten a home loan yet. But he thinking about building a credit score. Credit cards can be a secret tool. Here’s the deal: Start by getting a credit card, and use it for small, manageable purchases, like groceries or gas. Pay off the full balance on time as a responsible person. This consistent payment history works like magic to boost one’s credit score over time.
I received a unique query on this bill payment method. I’m sharing my chat with the individual.
It is acceptable to credit the credit card account right after every purchase. Though it is not a necessity for efficient credit card management. Even if one clears the full credit card bill on time, before the due date, it is enough. Maintaining a low credit utilization ratio is also a very impactful factor for the credit score.
No, there will be no negative effects. Crediting the credit card account immediately after every purchase is an acceptable practice. It can showcase financial responsibility and reduces your outstanding balance sooner. It will contribute to a healthier credit utilization ratio. But again, the act of immediate crediting looks like a cumbersome activity. It is actually not necessary to do it. Paying the full credit card bill on time is sufficient.
Paying your credit card bill in full each month and maintaining a net-zero balance can have a positive impact on your credit score, but the extent of the impact may be limited compared to other credit-related factors. Here’s how it works:
Positive Payment History: One of the most significant factors affecting your credit score is your payment history. Paying your credit card bill on time and in full each month demonstrates responsible credit usage and can contribute to a positive payment history, which can boost your credit score over time.
Credit Utilization Ratio: Your credit utilization ratio is the percentage of your credit limit that you’re currently using. Keeping a net-zero balance means you’re not using any of your available credit, which can result in a low credit utilization ratio. A lower credit utilization ratio is generally favorable for your credit score. Experts often recommend keeping your credit utilization below 30% to maintain a good score.
Length of Credit History: Another factor in your credit score is the length of your credit history. If you consistently use your credit card and pay it off each month, you’re contributing positively to your credit history by demonstrating responsible credit management.
Mix of Credit Types: A diverse mix of credit types, such as credit cards, loans, and mortgages, can also positively impact your credit score. Using and managing a credit card responsibly adds to this mix.
However, it’s important to note that maintaining a net-zero balance on your credit card does not necessarily result in the highest possible credit score. Credit scoring models also consider other factors, such as the age of your credit accounts, the number of recent credit inquiries, and the presence of any negative items on your credit report (e.g., late payments, collections, or defaults).
To build and maintain a strong credit score, consider the following tips:
Pay All Bills on Time: Not just your credit card bill but all bills, including loans, utilities, and rent.
Maintain a Mix of Credit Types: If it makes financial sense, consider having a mix of credit types (e.g., credit cards and installment loans).
Monitor Your Credit Report: Regularly check your credit report for accuracy and address any errors promptly.
Limit New Credit Inquiries: Be cautious about applying for new credit too frequently, as multiple inquiries in a short period can negatively impact your score.
In summary, consistently paying your credit card bill in full each month and maintaining a net-zero balance can contribute positively to your credit score by building a positive payment history and keeping your credit utilization low. However, it’s just one aspect of your overall credit profile, and other factors also play a role in determining your credit score.
Having a net zero credit card bill at the end of each month is also a good practice. However, its direct impact on your credit score might not be as significant as other factors. While it demonstrates discipline, one’s credit score is influenced by various factors. The other factors are payment history, credit utilization, length of credit history, recent credit inquiries, etc.
Several factors have a strong impact on building and maintaining a good credit score. These factors are crucial for demonstrating responsible credit management and financial stability. Here are some of the key factors that can have a significant influence on your credit score:
Payment History: Payment history is one of the most important factors affecting your credit score. It accounts for a substantial portion of your score. Consistently making on-time payments for all your credit accounts, including credit cards, loans, and mortgages, is essential for a positive payment history.
Credit Utilization Ratio: Your credit utilization ratio is the percentage of your available credit that you are using. Keeping this ratio low, ideally below 30%, is important for maintaining a good credit score. High credit utilization can negatively impact your score.
Length of Credit History: The length of your credit history matters. The longer you’ve had credit accounts in good standing, the more positively it can affect your score. It’s one reason why it’s generally advisable to keep older credit accounts open, even if you don’t use them regularly.
Types of Credit: A diverse mix of credit types can positively influence your credit score. Having a combination of credit cards, installment loans, and mortgages can demonstrate your ability to handle different types of credit responsibly.
New Credit Inquiries: Each time you apply for new credit, it generates a hard inquiry on your credit report. Too many hard inquiries in a short period can lower your score. It’s important to be cautious when applying for new credit and only do so when necessary.
Public Records and Collections: Negative items like bankruptcies, tax liens, and accounts in collections can significantly damage your credit score. Avoiding these issues is crucial for maintaining good credit.
Credit Age: The average age of your credit accounts is another factor. Older accounts with a positive payment history can contribute positively to your credit score.
Credit Mix: Having a mix of credit types, such as credit cards, retail accounts, installment loans, and mortgages, can positively impact your credit score, as it demonstrates your ability to handle various financial obligations.
Derogatory Marks: Negative information, such as late payments, accounts in collections, or bankruptcies, can have a severe negative impact on your credit score. Avoiding these issues is essential for maintaining a good credit profile.
It’s important to note that building and maintaining a good credit score takes time and responsible financial behavior. While some factors, like payment history and credit utilization, have a more immediate impact, others, like the length of your credit history and credit mix, develop over time. Therefore, it’s essential to practice good financial habits consistently and avoid negative credit behaviors to achieve and maintain a strong credit score.
To effectively build and improve your credit score, one can focus on the following factors:
Timely Payments: Consistently paying the bills on time is the most influential factor in shaping your credit score.
Length of Credit History: The longer is one’s credit history, the better. Hence, one must avoid closing old credit card accounts. Transactions on old cards can contribute more positively to building a healthier credit score.
Types of Credit: A diverse mix of credit types, such as credit cards, personal loan, and home loan, can enhance one’s credit profile further.
New Credit Inquiries: When we apply for a loan or a new credit card, it triggers a new credit inquiry. Limit the number of new credit inquiries. Excessive inquiries within a short period can negatively impact one’s score.
It is an important factor of credit card management. Moreover, clearing the full card bill before the due date is even more important. Paying on time is like acing a financial test. It helps you avoid late fees, interest charges and maintains a positive credit history.
Absolutely, even one late payment can leave a mark on one’s credit score. It’s like a small stain on the financial record that will take time to fade away. Hence it is best to avoid late payment even once. Consistency in paying on time is vital for a strong credit history and a healthier credit score in the long run.
Using a credit card for ATM cash withdrawal isn’t the best move. It is also important to note that cash advances often come with high fees and immediate interest. ATM cash withdrawals using a credit card can also impact the credit score.
Yes. Paying credit card bills early can lower the average credit utilization over a billing cycle. This show as responsible behavior. Plus this way, one is more likely to stay on track and never miss a due date. So, repeatedly paying early not only reduces the balance sooner but also gives your credit score a little boost over time.
If you can’t pay the full credit card bill by the due date, it’s okay, but there’s a catch. While your credit score won’t take an immediate hit, not paying in full might lead to higher credit utilization. This can potentially impact the score over time. Though, paying only the minimum amount is better than not paying anything.
Yes. Paying on time can enhance one’s home loan or car loan eligibility. Lenders consider our payment history when evaluating our creditworthiness. A strong record of on-time payments enhances our credibility. It can lead to better interest rates, or at least it opens the door for interest rate negotiations.
Mastering credit card management is a necessary step toward financial well-being. The practice of crediting our account immediately after each purchase calls for discipline. But when it comes to overall credit card management, it’s just one piece of the puzzle. But it will also not be wrong to say that instant credits after every purchase is a bit of overkill and unnecessary
Paying credit card bills on time (before the due date) remains paramount, and it is more than enough.
While the concept of maintaining a net zero credit card bill at the end of each month appears enticing, it’s essential to recognize that credit scoring algorithms consider a holistic view of your financial behavior. Timely payments, prudent credit utilization, and a diverse credit mix are instrumental in shaping your creditworthiness.
We can showcase our dedication to the algorithm that we are doing our best by maintaining a low outstanding balance, and timely credit card bill payments, but instant credits after every purchase is unnecessary.
This is an attempt to do a quick fundamental analysisof Expleo Solutions. The purpose of this article is to get an idea about what is a fair price (Intrinsic value) of the company’s shares. Currently, the stock price of Expleo Solutions is trading at approximatelyRs.1,400 per share.
Theproof of the underperformanceis very visible when we compare the Nifty IT index with other indices of the Indian stock market. In the last 12 months period, the Nifty IT index has gone up by 6.89%. It is even weaker than the performance of the broader index Nifty50 (up by 10.41%) and the S&P BSE Large Cap index (up by 7.49%). In the same period, the Midcap and Smallcap Indices have gone up by 25% and 28% respectively.
Hence, there is no doubt that the IT sector is not performing as well as other sectors.
We’ve already established that IT sector is not performing like other sectors. Within the IT sector, the performance of the stock of Expleo Solutions is even not at par.
In the last 12 months, when the Nifty IT index has gone up by 6.88%, Expleo’s stock has gone up by only 4.62%.
Moreover, the person who approached me, digged some more into the company. He found that, in the last 10 years, the performance of the stock of Expleo has been quite good. He came to me with this data:
Price Trend
Growth (CAGR)
Remarks
3 Months
-12.98%
Sudden Fall in Aug’23
3 Years
33.61%
COVID Crash Effect
5 Years
21.39%
–
10 Years
16.22%
–
In the last three, five and ten years, the stock price has grown at a rate of 33.61%, 21.39%, and 16.22% per annum respectively. Also, the in the last 3 months, theshare price has corrected by about 13%.
So the person approached me with the query, What is the right time tostart accumulating Expleo Solutions? The person was interested to buy and hold this stock for the long term (over 5 years).
Hence, I decided to do a quick fundamental analysis of this company.
I did a quick check of the company on my Stock Engine App. My app’s algorithm wants to wait for a correction before buying the stock. It is an indication that the algorithm thinks that the company’s fundamentals are good but its price is overvalued. The stock engine estimates that the current price is about 2.5 times the fair price, which makes it very overvalued.
The other quick indicators (ratings on a scale of 0 to 5) from my stock engine gave these values:
Parameters
Scores
Price valuation
0.5 / 5
Profitability
5 / 5
Growth
5 / 5
Financial Health
3.59 / 5
Quality of Management
3.67 / 5
Moat Score
3 / 5
Seeing these values, the Stock Engine’s algorithm has given this company an overall score of 62%. An ideal overall score for any stock is 75% minimum. But the overall score of Expleo is not too low, I decided to do a manual fundamental analysis of it.
Expleo Solutions is a leading player in the global IT and consulting services domain. Its business model encompasses a range of products and services, catering to a wide customer base. We’ll delve into the details of their business model, highlighting their offerings, customer segments, and competition.
Expleo Solutions offers a portfolio of services aimed at driving digital transformation and innovation for businesses across various industries. Their services can be broadly categorized as follows:
IT Consulting and Solutions: It specializes in providing end-to-end IT consulting and solutions. The solution includes software development, application modernization, and technology implementation. This includes technologies like artificial intelligence (AI), machine learning (ML), and blockchain.
Quality Assurance and Testing: The company is also a player in quality assurance and testing services. They ensure the reliability and functionality of software applications through testing processes.
Digital Transformation: Expleo Solutions facilitates digital transformation journeys for businesses. This includes implementing cloud solutions, data analytics, and automation to enhance operational efficiency.
Engineering Services: The company provides engineering services across various domains, including aerospace, automotive, and manufacturing. These services encompass product design, prototyping, and validation. A few examples of product designing includes ADAS camera system development, providing RAMS-cybersecurity support, etc,
In a competitive landscape, Expleo Solutions faces competition from various players in the IT services and consulting sector. While the specific competitors may vary based on the region and industry, some notable contenders include well-established companies offering similar services. Expleo Solutions faces competition from several prominent companies in the IT services and consulting sector.
These companies, along with others in the industry, compete with Expleo Solutions in delivering IT solutions and services to clients in India and beyond.
We’ll use the DCF method of intrinsic value estimation to do the calculations. But before that, allow me to share key financial data (last 10 years change) which most of us follow for our stocks.
Description
YR 2023
YR 2014
Growth (CAGR)
Revenue
903.3
194.4
16.60%
EBITDA
216.2
49.9
15.79%
EPS
86.3
28.7
11.64%
Networth
530.2
108.2
17.23%
Working Capital
385.1
86.7
16.08%
Cash & Eqiv.
155.7
50.2
11.98%
Share Price
1400
460
11.77%
Looking at the last 10-year growth numbers of the company, it would be safe to assume that the company will at least grow at a rate of 12% per annum for the next 3 years at least.
Based on the cash flow report of the last two financial years of the company, the free cash flow to firm (FCFF) comes out to be as shown in the below table. All Values are in Rs. Crores.
Description
FY 2023
FY 2014
Net Profit (PAT)
133.89
67.68
Net Cash From Operations
23.08
24.23
Note: Operating Cash Flow
as % of PAT
17.2%
35.8%
Capex
44.20
25.43
Free Cash Flow To Firm
(FCFF) *
-21.12
-1.20
* FCFF = Cash From Operations – Capex
At the outset I would like to point out that, out of the net profit (PAT) reported for FY 2023 and 2024, the net cash flow from operations was 17.2% and 35.8% of the PAT. These two numbers have a strong hint towards weak account receivables on the part of a company. The company was not able to collect the due payments fast enough from its customers.
Generally, I would have discounted the “net cash from operations” for companies showing such weak account receivables turnaround. But as the net free cash flow is already coming in negative, I’ll skip the discounting.
Though the cash flow of the company is weak, the company is still investing in CAPEX to grow the company. As the company is nearly debt free, hence I’m assuming that the cash for the CAPEX is coming from the cash & cash equivalent reserves of the company. In the last two FYs, the cash position of the company has remained strong:
Description
FY 2023 (Rs.Cr.)
FY 2022 (Rs.Cr.)
Cash & Cash Equiv.
152.531
173.08
Free Cash Flow To Equity (FCFE)
The estimation of the Intrinsic value of a company, which we can compare with the current stock price, is derived from FCFE and not FCFF.
FCFE = FCFF – Net New Debt – Interest * (1 – Tax Rate)
As the calculated Free Cash Flow To Equity (FCFE) is coming in negative for the company, we’ll not proceed further with the calculations. We’ll assume that, based on cash in the cash flow report’s numbers, the estimatedintrinsic value is zero.
But we are not leaving the matter here, we will do the estimation by calculating the free cash flow using the company’s profit and loss accounts.
There is another formula to calculate the free cash flow generated by a company. This formula is specifically useful for such companies whose cash collection cycles are generally delayed. Expleo Solutions being a company from the IT service sector, should have shown a stronger cash flow report. But anyway, for the moment we’ll live with it.
The formula for FCFF using a P&L account looks like this:
FCFF = PAT + D&A – Capex – Increase in Working Capital
For the FCFF calculation, most of the data is directly available in the company P&L account, and cash flow report.
Description
FY 2023 (Rs.Cr.)
FY 2022 (Rs.Cr.)
Remarks
PAT
133.89
67.68
P&L Account
Depreciation
27.884
18.764
P&L Account
Capex
44.20
25.43
Cash Flow Report
But to get to the value of Increase in Working Capital, we’ll have to do a few calculations:
Description
FY 2023 (Rs.Cr.)
FY 2022 (Rs.Cr.)
Remarks
Current Assets
552.7
448.5
Balance Sheet
Current Liability
167.73
174.591
Balance Sheet
Working Capital
384.97
273.909
–
Increase in Working Capital
111.061
–
–
Let’s use the above data to estimate the Free Cash Flow to Firm (FCFF) of Expleo Solutions. It is a point worth highlighting that though the company’s “net cash flow from operations” was not strong, its current asset and cash base are robust. This is the reason why, the company is likely to perform well even if its cash flow is not as strong (because of the available cash).
Let’s use this formula to estimate FCFF:
FCFF = PAT + D&A – Capex – Increase in Working Capital
So, we can see that using this method, we are able to see a positive free cash flow (FCFE). Now, we can use this positive value to estimate the intrinsic value of the company.
But to do that, we will have to first assume a free cash flow growth number for the next 3 years. We’ve already observed the past number and have taken an informed guess of 12% per annum.
But we’ll use another method to estimate the free cash flow growth rate.
Based on the return generated by the company from its equity capital, we can estimate a future growth rate for the company’s free cash flows. If you want to know more about the concept on which the SGR is based, read this article.
In short, the concept says that ROE is the rate at which the company can grow its FCF in times to come (near term). But if the company is paying dividends, it means, it is not retaining all its net profits. Hence, the ROE factor (PAT / Net Worth) must be adjusted for the dividend payouts of the company.
For companies, that do not pay dividends, their SGR will be equal to their ROE.
Let’s first calculate the ROE and Dividend payout ratio of the company:
Description
FY 2023 (Rs.Cr.)
FY 2022 (Rs.Cr.)
PAT
133.88
67.678
Networth
530.2
394.578
ROE
25.25%
17.15%
Dividend / Share
5
0
No of Shares (Crore)
1.552
1.552
Dividend Paid
7.76
0
Dividend Payout
5.8%
0.00%
The company’s dividend payout ratio in FY 2023 is 5.8%. But in FY 2022, it paid no dividends. In the last 10 years, the company has been known for paying very high dividend payouts to its shareholders. In the past years, its payout ratio has been in the range of 30% to 110%.
Last 10-Year Data
Description
2023
2022
2021
2020
2019
2018
2017
2016
2015
2014
PAT
133.9
67.7
50.4
39.9
36.2
31.9
23.2
36.9
21.6
30
Div / Share
5
0
0
0
0
24
24
24
25
9
No of Shares (Cr)
1.552
1.552
1.0252
1.0252
1.0713
1.071
1.068
1.0639
1.0545
1.0268
Dividend
7.76
0
0
0
0
25.704
25.632
25.5336
26.3625
9.2412
Payout (%)
5.8%
0.0%
0.0%
0.0%
0.0%
80.6%
110.5%
69.2%
122.0%
30.8%
But I’m making a guess that going forward from the year 2023, being a growing company, it will not exceed the dividend payout by more than 15%.
The intrinsic value of the company can now be calculated from the sum of the present values (PVs) of future cash flows of the company. To calculate it, we can use the below formula:
Intrinsic Value = Sum of All Future FCFs / No of Shares
For Expleo Solutions, we have already seen that the number of shares outstanding is 1.552 Crore Number.
When I started analyzing the company, the first impression I got about it was good. But slowly, when I started to get into its cash flow reports, the positive impression began to fade.
As the company is not able to generate enough free cash flow, its intrinsic value is coming out as too low compared to its current price.
But if I see the P/E ratio of the company in the last 5 years, the company does not look as overvalued. A fair PE of 15 looks acceptable for Expleo.
Hence, at the current EPS of Rs. 61.72 per share, the fair price of the company’s stocks will be Rs. 925 per share ( = 61.72 x 15).
Taking a rough average of the Intrinsic value calculated using the DCF and Fair PE method, I assume that the intrinsic value of the company falls somewhere between Rs.500 and 600 per share.
Even then the share price of Expleo Solutions looks very overvalued (almost 2 to 2.5 times its intrinsic value).
The impact of the rate hikes will vary depending on the sector and the company. Companies that are highly leveraged and rely ondebt financing will be the most affected. These companies may have to cut back on their investments and operations, which could lead to lower earnings and stock prices.
However, the impact of the rate hikes is not only negative. Some sectors, such as Banks and NBFCs, could benefit from the higher interest rates. They will earn more money from lending. They will see their profits improve as their borrowers will pay higher interest rates on their loans.
Let’s get deeper into the basics of how the rising interest rates impact the stock market.
After COVID-19, inflation is on the rise all over the world. All major economies of the world are impacted by the rising inflation scenario. Developed country like the USA and countries in the European Union was dealing with inflation at 1% or below levels. But post-COVID, the decades of low inflationary economy seem to have ended. Even the USA and UK are now dealing with 8% level inflation rates.
Economies
Year-2020
Year-2023
Rise By
USA
1.23%
8%
6.77%
UK
0.99%
7.92%
6.93%
Germany
0.14%
6.87%
6.73%
France
0.48%
5.22%
4.74%
Italy
-0.14%
8.20%
8.34%
S.Korea
0.54%
5.09%
4.55%
Japan
-0.03%
2.50%
2.53%
Australia
0.85%
6.59%
5.74%
India
6.62%
7.44%
0.82%
Brazil
3.21%
9.28%
6.07%
South Africa
3.21%
7.04%
3.83%
Indonesia
1.92%
4.21%
2.29%
Malaysia
-1.14%
3.38%
4.52%
The USA and major economies of the European Union have seen a stubborn rise in inflation. Hence, in those countries, the focus came on the interest rates. Though India is not as affected by the growth in inflation rates, being a fast-developing country, it can quickly go off limits. Hence, the Indian government has kept the Repo Rates tight since October 2020.
The repo rates are taken as a reference to decide the interest on all types of bank loans. In a rising repo rate scenario, bank loans charge high-interest rates. Moreover, repo rates are also a basis for discount rates of future cash flows. It is used to calculate the present values of all future cash flows.
This is the reason why, when interest rates are rising in an economy, it impacts the related stock market.
Central Banks of all major economies of the world are raising interest rates to tame inflation. However too high rates can have a negative effect on the GDP growth.
So, as a stock market investor, we must know that there must be a balance between inflation, interest rates, and the GDP growth rate. In a falling interest rate scenario, a quick bull run is common. But in a balanced economy, a slow but steady bull run can be achieved.
When we say stock market, we are either talking about the major indices like Nifty 50 or Sensex, or the individual stocks. When interest rates are on the rise, it generally affects the stocks and indices negatively.
Generally speaking, there could be four ways in which a rising repo rate can affect the stock market as a whole.
Companies Make Less Profits: Capital-intensive companies who rely more on debt to finance their working capital and growth, generally have a heavy loan book. When interest rates are on the rise, the interest expense of these companies increase. This in turn decreased the company’s absolute profit and profitability. The falling profits and margins work as a drag on their stock’s price. The majority of companies are affected by rising interest rates, hence the stock market as a whole gets negatively affected.
Alternative Investments Look Dearer: Rising inflation hence interest rates cause devaluation of currency. During a high inflationary environment, investors invest more in alternative investments like gold and real estate. Furthermore, when interest rates are rising, fixed instruments like bonds and deposits also fetch better returns. Hence, investors shift there as well.
These four reasons caused by rising interest rates negatively affect the stock market.
It is clear that rising repo rates are neither liked by people nor the corporates. But are all companies equally impacted by the rising repo rates? Which companies are most and least affected:
Banking stocks and NBFCs are positively affected by the rising repo rate scenario. As per the business model of these financial stocks, they lend money to society and make money. In a rising interest rate scenario, they can collect more due to elevated interest rates. It means some companies are happy when RBI starts to hike the repo rates. Hence, in the rising interest rates regime, banking and NBFC stocks become top performers while other stocks are struggling.
Blue chip stocks that pay consistent dividends are preferred during such times. During times of negative sentiments, investors try to play safe. They keep their funds safe in a bank as fixed deposits or simply as cash. If at all they want to venture into equity, they will prefer stable, established companies. Dividends paid by such companies become like icing on the cake for the investors.
Companies operating in the healthcare sector perform better (relatively) in a negative environment. No matter how high are the interest rates, people generally do not compromise when health is calling. In a situation when all companies are doing badly, generally, hospitals, labs, pharma stocks, etc. do relatively well.
New-age growing companies are most affected by the rising interest rate conditions. These are companies that are currently thriving on debt to fund their fast growth leading to market capture. To an extent, such companies are dependent on debt even to finance their working capital. These companies mostly report losses currently. Hence, rising interest rates make their interest outgo even higher leading to more losses.
This is the reason why such companies often want Private Equity funding which are interest free. However, not all companies can secure PE funds.
Even if these companies are making profits, their shares trade at very high price-to-earning multiples. When interest rates are rising, investors may not buy shares at such high multiples leading to more selling.
Hotels, restaurants, and companies in the entertainment industry are also negatively affected. In the rising rate scenario, people and corporations are spending less. This happens as debt becomes costly and negative sentiments also prevail. This badly affects the performance of such companies.
When inflation is rampant, RBI tweaks the repo rate (interest rates) to control inflation. However, this method to keep inflation well within its peak can harm the stock market. During such times, growth stocks, new-age startups, and consumer spending-dependent industries face detrimental outcomes.
Moreover, while analyzing Expleo Solutions, its weak net cash flow raised doubt about the quality of cash flows of all IT-service sector stocks. Hence, this analysis is also aimed at establishing the quality of cash flow generated by quality companies in this industry.
The IT sector has been facing some headwinds since the last year or so. It is a reasonable time for long-term investors to accumulate strong stocks in this sector. TCS and Infosys being the market leader become an automatic pick. But these companies have become very large in size. Unless these stocks are accumulated at a sufficient undervaluation, capital growth may not even beat the index.
The purpose of this article is to first estimate the intrinsic value of Infosys. Then we’ll alsolook at the technicals and establish a possible buy level in case the market corrects in the next weeks.
Infosys is a global leader in digital services and consulting. It offers investors an exciting opportunity to participate in the evolving landscape of tech space.
Infosys stands out as a good partner for enterprises worldwide. It delivers digital solutions and transformative technology services. Investing in Infosys offers a promising outlook for several reasons:
Digital Transformation Demand: As companies across industries race towards digital transformation, Infosys is to play a pivotal role. The increasing reliance on technology, automation, and data-driven decision-making creates a significant market for Infosys’ expertise.
Global Expansion: Infosys’ global presence provides a strong advantage. With a customer base spread across the world, the company’s ability to tap into diverse markets and adapt to regional demands fuels growth potential.
Evolving Services Portfolio: Infosys evolves its services portfolio to match market trends. Whether it’s AI-powered solutions, cybersecurity advancements, or sustainable practices, the company addresses current challenges and future opportunities.
Strategic Partnerships: Collaborations with tech giants, startups, universities, and hyper scalers strengthen Infosys’ capacity. These partnerships ensure access to cutting-edge technologies and extend its reach into emerging domains.
Enterprise Risk Management: Infosys’ strong focus on managing risks ensures stability and resilience. By identifying and mitigating potential challenges, the company ensures growth while protecting investor interests.
Currently, Infosys stocks are trading at price levels of Rs.1425. A correction of about 10-12% will bring it into the zone of Rs.1265 levels. The stock was at those levels in April’2023 and then it rebounded sharply. It looks like, Rs.1265 is a good support level for Infosys.
So, just by looking at the price trends, trying to buy Infosys at Rs.1265 levels will give a blanket 10% advantage. Considering that, in the long term, this stock is expected to only go up, a 10% correction from current levels will bring Infosys to my buy levels.
But we must not buy any stock like this, without checking their fundamentals. No matter what the technicals say, if the fundamentals do not support the price, the price will fall.
Let’s get to the next step and start doing the price valuation of Infosys based on its financials.
We’ll calculate the free cash flow of the company using the numbers published in the cash flow report. We’ll repeat the same using the numbers published in the profit and loss account.
But before going into the financial reports of the company, let me show you the past 10 years’ numbers of Infosys.
Description
FY 2023
FY 2014
Growth
(CAGR)
Revenue (Rs.Cr.)
1,49,468
85,557
5.74%
EBITDA (Rs.Cr.)
37,831
23,052.00
5.08%
PAT (Rs.Cr.)
24,108
15,410.00
4.58%
Reserves (Rs.Cr.)
73,338
44,244
5.18%
Total Assets (Rs.Cr.)
1,25,816
1,17,885
0.65%
Net Cash From
Operations (Rs.Cr.)
22,467
9,825.00
8.62%
The growth numbers of the company in the last 10 years have not been great. On the basis of the past number, we can expect the company’s earnings to grow at a growth rate of about6% in the next 5 years.
With these as our initial impression about the company, let’s get into the free cash flow analysis of Infosys.
Before going into the next step, let’s confirm the quality of the cash flow of Infosys. We’ll do it by comparing how much “Net Profit (PAT)” the company is about to convert into “cash” each year.
As you can see, even in the worst of times, the company was able to convert nearly 50% of its PAT into cash flows. Since 2011, its quality of cash flow has only increased. As of today, about 90% of its PAT gets converted into cash flows. This is a great sign of quality. Hence, we’ll use the FCFF value calculated above, as it is, without applying any discounting factor.
Note: In our analysis of Expleo Solutions, the quality of cash flow was not up to the mark. Rather, it had very weak cash flows reported in FY2022-23.
Let’s use a second method to calculate FCFF.
The formula that will be used is this:
FCFF = Net Profit + D&A – Capex – Increase In Working Capital
Free Cash Flow To Equity (FCFE) can be calculated from FCFF (as calculated above). The formula for FCFE is as shown below:
FCFE = FCFF + Net New Debt – Interest * (1-Eff. Tax Rate)
Description
FY 2023
FCFF
22,834
Net New Debt
0.00
Interest
284
Eff. Tax Rate
27.65%
FCFE
22,629
Infosys is a debt-free company. Hence the value of “net new debt’ is zero. To estimate the effective tax rate, we have used the formula = tax paid / PBT.
Using the formulas, the final value of FCFE calculated for onward estimation of the intrinsic value is Rs.22,629 Crore.
We’ve already calculated the FCFE of Infosys in the above steps. But this is the thing about the past. To estimate the intrinsic value of Infosys, we’ll need to estimate the free cash flow (FCFE) of the future. To do it, we must assume a suitable FCFE growth rate.
The measure of FCFE growth rate can be done using the SGR Formula. The formula looks like this:
SGR = ROE * (1- Dividend Payout Ratio)
We’ll use the value from the annual report of Infosys to first calculate the ROE and Dividend Payout Ratio. Then, we’ll use the above formula to calculate the SGR.
Now, we have two important numbers, Free Cash Flow To Equity (FCFE of Rs.22,629 crore) and the Future Growth Rate (@7% per annum) for the next 5 years. Beyond the fifth year, we’ll assume that the company will grow at a sustainable growth rate of only4% per annum.
What we see in the above table is a gradual increase in the free cash flow of Infosys at the rate of 7% per annum. In the next five years, the company will grow its current FCFE from Rs. 22,629 Crore to Rs.32,026 Crore.
This is the free cash flow that the company will generate for the rest of its life beyond the fifth year. The way to calculate is by estimating the terminal value (TV) of the company. In the terminal value period, I’ve assumed a sustainable growth rate of only 4% per annum. We’ll use the below TV formula to do our calculations:
To do the conversion, we also need to assume a suitable discount rate. I have picked the value of 10% per annum.
What is the logic? Because it is an equity, the rate should be higher than the risk-free rate of 7.1% per annum. But as the company comes from a very large cap space, I do not want to overestimate the long-term growth potential. Infosys is a relatively safe investment, hence a 10% discount rate looks justified.
Let’s calculate the present value of all future cash flows:
Description
YR-1
YR-2
YR-3
YR-4
YR-5
TV
Future Cash Flows
24,433
26,143
27,973
29,931
32,026
4,16,339
Present Value (PV)
22,211
21,606
21,016
20,443
19,886
2,35,012
Sum of PV
3,40,175
–
–
–
–
–
So, the sum of all future cash flows of Infosys is estimated at Rs. 3,40,175 Crores.
As of date, the company has issued about 414,85,60,044 number shares (414.85 Crore) outstanding in the market. We’ve already estimated the present value of all future cash flows of Infosys as Rs. 3,40,175 Crore. Hence, the intrinsic value of Infosys comes out as below:
Infosys is fundamentally a powerhouse. This is evident when we analyze the quality of its cash flows for the last 20 years. The company is able to convert most of its Net Profits (PAT) into cash flow. In the last five years, it has converted about 100% of its PAT into cash flows. This is a clear sign of strong business fundamentals.
Looking at the last five year’s PE history of Infosys, it looks like the fair PE of the company should be around the PE20 mark. At the current EPS of Rs.59.23, the fair price of the company comes out to be about Rs.1,195 per share.
Using the DCF method, we’ve estimated the intrinsic value of the company as Rs.820 per share.
An average of the PE20 and DCF would give an intrinsic value of aboutRs.1,000 per share.
We have also seen the technical price chart of Infosys. There it seemed like Rs. 1270 should be a good buy level for Infosys.
I’ll wait for Infosys share price to fall between Rs.1,000 and Rs. 1,270 levels before taking a buy call.
To me, this company is a super-strong stock. Buying this stock at Rs.1,000 levels can potentially give a 12.5% CAGR capital appreciation. The holding time expected is about 3-5 years.
The UPL Limited has been in my stock portfolio for some time. At the current valuations, the company is valued at Rs.45,000 crores as its market capitalization. In the last 10 years, this stock has yielded a price appreciation of about 20% per annum. Now, I’m trying to reevaluate my holdings in this company.
The last 10-year price data of UPL Limited shows a decent picture. But in the last 5 years, the stock has remained mostly flat. The CAGR (growth) of the stock price has been a dismal 6.6%. For an equity investor, this is not acceptable. Five years of holding time is a decent long-term, and a below-average return of 6.6% is bad. Even Nifty 50has given an 11% CAGR return in the last 5 years.
So, for long-term investors like me, it is time to reevaluate our holdings in this stock. In normal circumstances, I would have sold this stock feeling happy that the stock did its job in my last 10 years of holding (20% CAGR).
So, I’m evaluating whether should I consider selling my holding or buy more of it. Whenever I face this kind of dilemma, it is an indicator that I should do a thorough fundamental analysis of my stock.
When I say fundamental analysis, doing the analysis of a stock using the DCF Method is what I mean.
For such stocks that have remained flat for extended periods (like 5 years), I’ll rely only on the numbers from the cash flow report. It is a stringent method but forflattish stocks like UPL Limited, it is what is necessary.
The idea is to check, what has caused the stock to remain flattish for the last five years. The analysis will also unearth if I should add more to my holdings in this stock or rather sell it.
To calculate free cash flow to the firm (FCFF), we’ve two alternatives. But for UPL we’ll rely only on the values from its cash flow report. Why? Because I want my conclusion to be close to reality. I’ve more confidence on the numbers of the cash flow report.
We need the following values to estimate its FCFF:
Net Cash Flow From Operating Activities.
Capex.
Description
2023
2022
PAT
4,414
4,437
Net cash flow from operating activities
7,751
6496
CAPEX
-1,672
-2,022
FCFF
6,079
4,474
The free cash flow to the firm comes out to Rs. 6079 and Rs. 4474 crores in the last two years. During these two FYs, the company has reported a net profit of Rs.4,414 and 4,437 crores respectively.
Net cash flow from operating activities is actually higher than the PAT. It is a big positive.
But before we can finally conclude if the free cash flow is healthy for its investors or not, we must calculate the free cash flow to equity (FCFE).
Please Note: We can also use another formula to calculate the FCFF. This formula is FCFF = PAT + D&A – Capex – Increase in Working Capital. Using this formula as well, the FCFF of UPL Limited comes out to be Rs.4,042 Crore in the FY 2022-23. To know how to calculate FCF, check this article.
FCFF and FCFE are both measures of a company’s free cash flow. However, there are some key differences between the two.
FCFF: FCFF is the cash flow available to all types of investors. Here, both shareholders and debt providers to the company are referred to as investors.
FCFE: FCFE is the cash flow available only to shareholders.
When we are doing DCF analysis, we are mainly doing it as an existing or prospective shareholder of the company. Hence, for us, FCFE is the required metric. To know more about FCFF and FCFF, read this article on free cash flow.
To calculate FCFE, we’ll need the following numbers:
Free Cash Flow To Firm (FCFF).
Net New Debt (= Net Debt taken – Debt Repaid).
Interest Paid (Finance Cost).
Effective Tax Rate.
Description
2023
2022
FCFF
6,079
4,474
Net New Debt
-4,595
1,306
Interest
2,345
1,941
Tax Rate
14.74%
10.65%
FCFE
-515
4,046
You can see that, in FY 2022-23, the Free Cash Flow (FCFE) for the company comes out as negative.
In a way, it is good that the company is using its cash flows to get rid of its loan burden. But the immediate effect of these loan paybacks is causing its FCFE (free cash flow) to go into negative.
To understand why the debt is draining so much of the company’s cash flows, we must also look at its capital structure.
Negative free cash flow to equity is like negative net profit. To the owners (shareholders) of the company, Free Cash Flow To Equity (FCFE) is the real profit. A positive PAT or FCFF is not as relevant.
So, for UPL Limited, we’ve seen that though the company has posted good PAT and FCFF numbers, its FCFE is still negative in FY 2022-23. The reason for this negative reporting was debt repayment, both principal and interest.
To understand why so much cash is flowing out to manage debt, let’s look at the company’s capital structure and its debt-to-equity ratio.
Description
Mar-23
Mar-22
Mar-21
Mar-20
Mar-19
Net Worth
26,858.00
21,675.00
17,901.00
16,296.00
14,715.00
ST Borrowings
2,855.00
4,261.00
1,414.00
1,298.00
2,478.00
LT Borrowings
20,144.00
21,605.00
22,146.00
27,371.00
26,383.00
Total Debt
22,999.00
25,866.00
23,560.00
28,669.00
28,861.00
Total Capital
49,857.00
47,541.00
41,461.00
44,965.00
43,576.00
Debt To Equity
0.86
1.19
1.32
1.76
1.96
Debt as % of Total Capital
46.13%
54.41%
56.82%
63.76%
66.23%
Out of the total capital of the company, nearly 50% is financed from debt. In the FY ending March ’19, the debt dependency was as high as 66.23%. The debt-to-equity ratio in the same year was 1.96, which is too high.
Though the company has tried to reduce its debt dependency in the last 5 years, its debt levels are still too high.
The result of this high debt is that the company is yielding negative free cash flow to equity (FCFE) which is detrimental to the shareholders.
If we look only at the company’s last 10 years reported numbers, the performance of UPL Limited is very good. From these numbers, it looks like that company is poised to grow at the rate of about 15% per annum.
Description
FY 2023
FY 2014
Growth
Revenue (Rs.Cr.)
54,053
10,902
17.36%
EBITDA (Rs.Cr.)
10,503
2,057
17.71%
PAT (Rs.Cr.)
4,257
942.10
16.28%
Reserves (Rs.Cr.)
26,708
5,162
17.87%
Total Assets (Rs.Cr.)
88,577
12,858
21.29%
Net Cash From Operations (Rs.Cr.)
7,751
1,442.11
18.31%
Projected Future Growth
–
–
15% p.a.
Some people might get carried away with these numbers and invest in UPL.
But when we drill into its free cash flows, we will see that there is no cash available for the shareholders (FCFE). The reason for this lack of cash is that most of its cash is being used to pay back the loan.
But does the negative FCFE make UPL non-investible? Absolutely not. Why? Because seeing the other fundamentals of the company, negative FCFE looks like a temporary phenomenon. The kind of market share the company has, cannot be ignored. Such stocks must be bought at a higher margin of safety.
Suppose, in the next two years, the company manages to convert its FCFE into positive. Currently, its FCFF is about Rs.6,000 Crore. Let’s say, it is able to convert about 10% of its FCFF into FCFE (Rs.600 Crore). Assuming a slow normal period growth rate of 12% and nominal growth rate of 3%, at a 12% discount rate, the intrinsic value of UPL comes out to be Rs.560 per share.
At thecurrent price level of Rs.600, it is trading at a PE multiple of 16.5. If the stock’s price corrects by another 10% to 15% from these levels, I may consider reinvesting in it.
For the moment, I’m neither selling nor buying. I’ll say, between Rs.500 and Rs.575, for me, this stock is a decent long-term buy (holding period 10 years).