
Introduction to Stock Chart Patterns
Introduction to Stock Chart Patterns
Chart patterns are specific formations that occur on financial charts, particularly in stock market analysis, which help traders and analysts predict future price movements based on historical patterns. These patterns are formed by the price movements of an asset over time and are used to make informed decisions about buying, selling, or holding investments.
Introduction to Stock Chart Patterns
Stock chart patterns often signal transitions between rising and falling trends. A price pattern is a recognizable configuration of price movement identified using a series of trendlines and/or curves.
When a price pattern signals a change in trend direction, it is known as a reversal pattern; a continuation pattern occurs when the trend continues in its existing direction following a brief pause. There are many patterns used by traders—here is how patterns are made and some of the most popular ones.
Here are some common chart patterns, their rules, and studies:
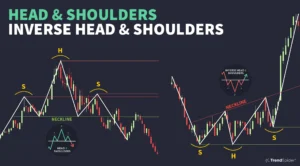
- Head and Shoulders Pattern:
- Formation: Consists of three peaks – a higher peak (head) between two lower peaks (shoulders).
- Rules:
- The neckline is formed by connecting the lows of the two troughs (shoulders).
- A breakout below the neckline suggests a bearish trend reversal.
- Volume tends to decrease as the pattern forms and increases on the breakout.
- Study: Traders often wait for a confirmed breakout below the neckline before taking a short position.
Also Read:-What Is a Candlestick Pattern?
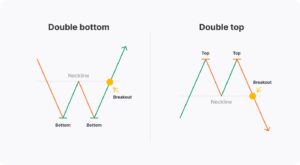
- Double Top/Bottom:
- Formation:
- Double Top: Two peaks at approximately the same level, indicating a bullish trend reversal.
- Double Bottom: Two troughs at approximately the same level, indicating a bearish trend reversal.
- Rules:
- For a double top, the price breaks below the support level (the trough between the peaks).
- For a double bottom, the price breaks above the resistance level (the peak between the troughs).
- Study: Confirmation through volume increase on the breakout helps validate the pattern.
- Formation:
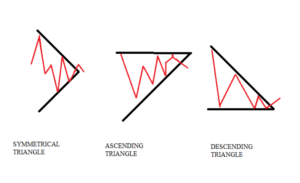
- Triangles (Symmetrical, Ascending, Descending):
- Formation: Converging trendlines representing tightening price ranges.
- Rules:
- Symmetrical: Both upper and lower trendlines converge, suggesting an upcoming breakout.
- Ascending: Higher lows with a horizontal resistance line.
- Descending: Lower highs with a horizontal support line.
- Study: Traders look for a breakout above/below the trendlines with increased volume.
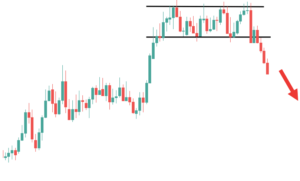
- Rectangle (Trading Range):
- Formation: Parallel horizontal lines representing a period of consolidation.
- Rules:
- Prices oscillate between support and resistance levels.
- Breakout occurs when the price moves decisively beyond these levels.
- Study: Confirmation of the breakout with higher volume is essential.
- Cup and Handle:
- Formation: Cup-like shape followed by a smaller, downward consolidation (the handle).
- Rules:
- Cup: Rounded bottom formation with a gradual decline and subsequent recovery.
- Handle: Consolidation after the cup, usually downward sloping.
- Study: Look for a breakout above the resistance formed by the handle.

These patterns and their rules are studied using technical analysis. Traders use various technical indicators, volume analysis, and historical price movements to confirm and act upon these patterns. It’s important to note that chart patterns aren’t foolproof; they provide probabilities rather than certainties and should be used in conjunction with other forms of analysis and risk management strategies.
KEY TAKEAWAYS
- Patterns are the distinctive formations created by the movements of security prices on a chart and are the foundation of technical analysis.
- A pattern is identified by a line connecting common price points, such as closing prices or highs or lows, during a specific period.
- Technical analysts and chartists seek to identify patterns to anticipate the future direction of a security’s price.
- These patterns can be as simple as trendlines and as complex as double head-and-shoulders formations.
How Many Types of Chart Patterns Are There?
Depending on who you talk to, there are more than 35 patterns used by traders. Some traders only use a specific number of patterns, while others may use much more.
What Is the Strongest Chart Pattern?
The strongest chart pattern is determined by trader preference and methods. The one that you find works best for your trading strategy will be your strongest one.
What Are the Different Graph Patterns?
There are generally three groups of patterns: continuation, reversal, and bilateral. Some traders classify ascending, descending, and symmetrical triangles in a separate group called bilateral patterns, and some only include symmetrical triangles in the bilateral group.
What Do Chart Patterns Mean?
Traders use chart patterns to identify stock price trends when looking for trading opportunities. Some patterns tell traders they should buy, while others tell them when to sell or hold.
[contact-form][contact-field label=”Name” type=”name” required=”true” /][contact-field label=”Email” type=”email” required=”true” /][contact-field label=”Website” type=”url” /][contact-field label=”Message” type=”textarea” /][/contact-form]