
What Is a Candlestick Pattern?
What Is a Candlestick Pattern?
Candlestick patterns are visual indicators used in technical analysis to predict price movements in financial markets, particularly in stocks, forex, and commodities. These patterns are formed by the open, high, low, and closing prices within a specific timeframe and are represented graphically through candlestick charts.
What Is a Candlestick Pattern?
- Hammer and Hanging Man:
- Hammer: It’s a bullish reversal pattern that occurs at the bottom of a downtrend. It has a small body near the high and a long lower shadow. This pattern suggests a potential trend reversal from bearish to bullish.
- Hanging Man: This is a bearish reversal pattern that appears at the top of an uptrend. It has a small body near the low and a long upper shadow. It indicates a possible trend reversal from bullish to bearish.
- Doji:
- A Doji occurs when the opening and closing prices are virtually equal, resulting in a small or no real body and long shadows. It represents indecision in the market and could signal a potential reversal or continuation, depending on its context and the preceding price action.
- Engulfing Patterns:
- Bullish Engulfing: This pattern consists of a small bearish candle followed by a larger bullish candle. The bullish candle completely engulfs the previous bearish candle’s range, indicating a potential bullish reversal.
- Bearish Engulfing: It’s the opposite of the bullish engulfing pattern. Here, a small bullish candle is followed by a larger bearish candle that completely engulfs the previous bullish candle’s range. It suggests a potential bearish reversal.
- Morning Star and Evening Star:
- Morning Star: It’s a bullish reversal pattern formed by three candles. The first is a large bearish candle, followed by a small candle with a gap down, and finally a large bullish candle. It indicates a potential trend reversal from bearish to bullish.
- Evening Star: This is the bearish counterpart of the morning star. It consists of a large bullish candle, a small candle with a gap up, and finally a large bearish candle. It suggests a possible trend reversal from bullish to bearish.
Also Read:-Types of Trading in the Stock Market
How to Read a Candlestick Pattern
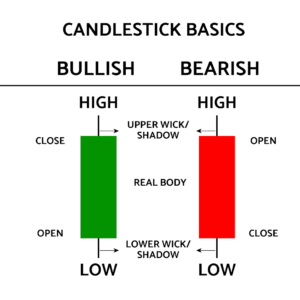
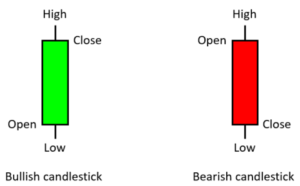
A daily candlestick represents a market’s opening, high, low, and closing (OHLC) prices. The rectangular real body, or just body, is colored with a dark color (red or black) for a drop in price and a light color (green or white) for a price increase. The lines above and below the body are referred to as wicks or tails, and they represent the day’s maximum high and low. Taken together, the parts of the candlestick can frequently signal changes in a market’s direction or highlight significant potential moves that frequently must be confirmed by the next day’s candle.
KEY TAKEAWAYS
- Candlestick patterns are technical trading tools that have been used for centuries to predict price direction.
- There are dozens of different candlestick patterns with intuitive, descriptive names; most also have a corollary pattern between the upside and downside. For instance, an “abandoned baby top” has its corollary in an “abandoned baby bottom;” “tweezer bottoms” have their upside corollary in “tweezer tops.”
- Traders supplement candlestick patterns with additional technical indicators to refine their trading strategy (e.g., entry, exit).
- Candlesticks are based on current and past price movements and are not future indicators.
It’s important to note that while candlestick patterns provide insights into potential market movements, they should be used alongside other technical indicators and analysis tools for better confirmation and decision-making in trading or investing. Traders often combine these patterns with other technical analysis methods to make more informed decisions about market entry or exit points.